COVID-19 dashboards
Here we will post a series of coronavirus, COVID-19 - related dashboards. We want to bring as much info and clarity as possible, to any person that wants to be…
HOW TO MAKE A GOOD DECISION
Since the early days, people are faced with making decisions based on choices at the given moment. Everyone wants to make the right one, whether it is related to private…
DataViz: Conditional coloring in BusinessQ
Have you ever thought why conditional coloring is so important in visualizations? Let me show you how we do it in BI software BusinessQ! With conditional coloring users and decision…
BusinessQ v19.0
We are happy to inform you that we have published a new version of BusinessQ (v19.0). What is new in v19.0 s SQL view In Raw Report Data part on reports and dashboards…
BusinessQ business intelligence software wins 2019 Awards from Platform for Software Reviews
We proudly announce that BusinessQ has just won the Rising Star 2019 Award and Premium Usability 2019 Award by FinancesOnline! We invested a lot of passion, efforts, interdisciplinary work, and…
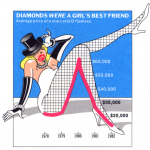
Chartjunk and why to avoid them
Term chartjunk refers to all visualizations, charts, and graphs that are not necessary while transferring information they stand for. Chartjunk can easily drag you off the optimal decision. That is…
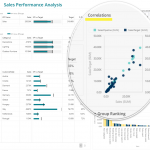
SCATTER PLOT: Definition and examples I BusinessQ
Definition Scatter plot is a powerful, two-dimensional data visualization tool. It can provide the decision maker with a lot of information. This visualization uses dots to represent the values obtained…
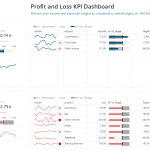
Be the best in your business – learn how to use KPI visualizations
KPI is a short term for Key Performance Indicators. “A KPI is a measurable value that demonstrates how effectively a company is achieving key business objectives.” [1] Organizations use KPI…
Best practice tips to successfully implement BI tools in 2019
We have noticed that most the companies now days aren’t absolutely sure how to start with implementing business intelligence tools. Here are a few tips that you may find…
LINE CHART: Definition and Examples | BusinessQ
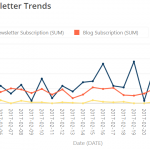
Definition A line graph is a chart that uses one or several lines to “show patterns in the data, such as trends, fluctuations, cycles, rates of change and how two…

