

BusinessQ v17.2
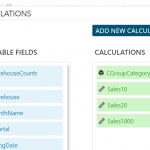
We are happy to inform you that we have published new version of BusinessQ (v17.2). Some of the most exciting news are Calculations that you can make on the level…
BusinessQ selected as one of Selected Croatian IT Solutions – 50UP! 2017
We are happy to inform you that our business intelligence and data visualization software, BusinessQ have been selected as one of Selected Croatian IT Solutions - 50UP! 2017. You can…
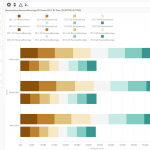
Stacked Bar chart : Definition and Examples | BusinessQ
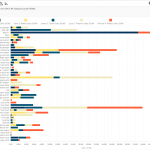
Definition A stacked bar graph (or stacked bar chart) is a chart that uses bars to show comparisons between categories of data, but with ability to break down and compare parts…
Bar chart : Definition and Examples | BusinessQ
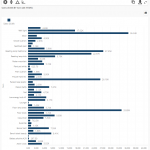
Definition A bar graph (or bar chart) is a chart that uses bars to show comparisons between categories of data. The bars can be either horizontal or vertical, so in…
BusinessQ 16 bubble plot dataviz
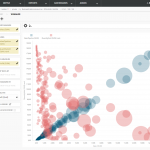
BusinessQ 16 bubble plot dataviz example In BusinessQ software, select appropriate data visualization from our carefully selected VISUALIZE tabs. This is an example od Bubble chart; Usage: Correlation Description: Similar…
BusinessQ 16 scatter plot dataviz 5000 points
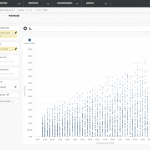
BusinessQ 16 scatter plot dataviz 5000 points In BusinessQ software, select appropriate data visualization from our carefully selected VISUALIZE tabs. This is an example od Scatter plot; Usage: Correlation…
BusinessQ 16 Dashboard example – Information Dashboard
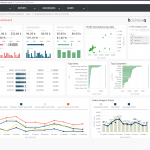
BusinessQ 16 Dashboard example - Information Dashboard Create appropriate BusinessQ Dashboards and take action on what is really important; stay up-to-date with what’s going in your business. Combine all…
BusinessQ 16 Dashboard example – Sales Dashboard
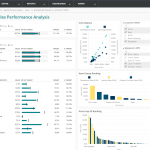
BusinessQ 16 Dashboard example - Sales Dashboard Create appropriate BusinessQ Dashboards and take action on what is really important; stay up-to-date with what’s going in your business. Combine all…
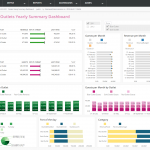
BusinessQ 16 Dashboard example – outlets yearly summary dashboard
BusinessQ 16 Dashboard example - hotel yearly summary dashboard Create appropriate BusinessQ Dashboards and take action on what is really important; stay up-to-date with what’s going in your business.…
Use of Color in Business Intelligence
The point of business intelligence Many business intelligence tools available today are failing to deliver actual intelligence. IT has made a great technical progress in data integration, cleansing of transformation…