Use of Color in Business Intelligence
The point of business intelligence
Many business intelligence tools available today are failing to deliver actual intelligence. IT has made a great technical progress in data integration, cleansing of transformation as well as in construction of big and efficient data warehouses. Nonetheless, we think that business intelligence industry has largely ingnored the fact that actual intelligence is within human beings. Therefore, raw information can only be valuable when it is understood and not just when it is available. If data is poorly represented, whole great data warehouse project was in vain.
Mission of BusinessQ
We want that our Business Intelligence tool, BusinessQ will leverage the strenghts of human perception in general. Very important part of that perception are our eyes (70% of perceptors in our body are in eyes!). Color can be used as a very powerful way to enhance the meaning and clarity of qualtitative data, but also can add problems if it’s used improperly. That is why in BusinessQ we made our own color palettes – we simply don’t want to allow report designers to make unfunctional reports.
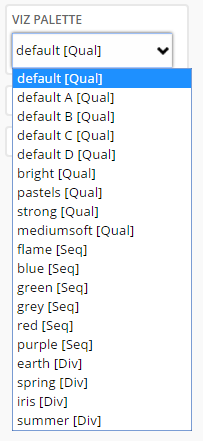
- Qualitative palettes – the ones that are used to separate items into distinct groups – hues are used to create the visual differences between items. Qualitative palettes are best suited to represent nominal or categorical data
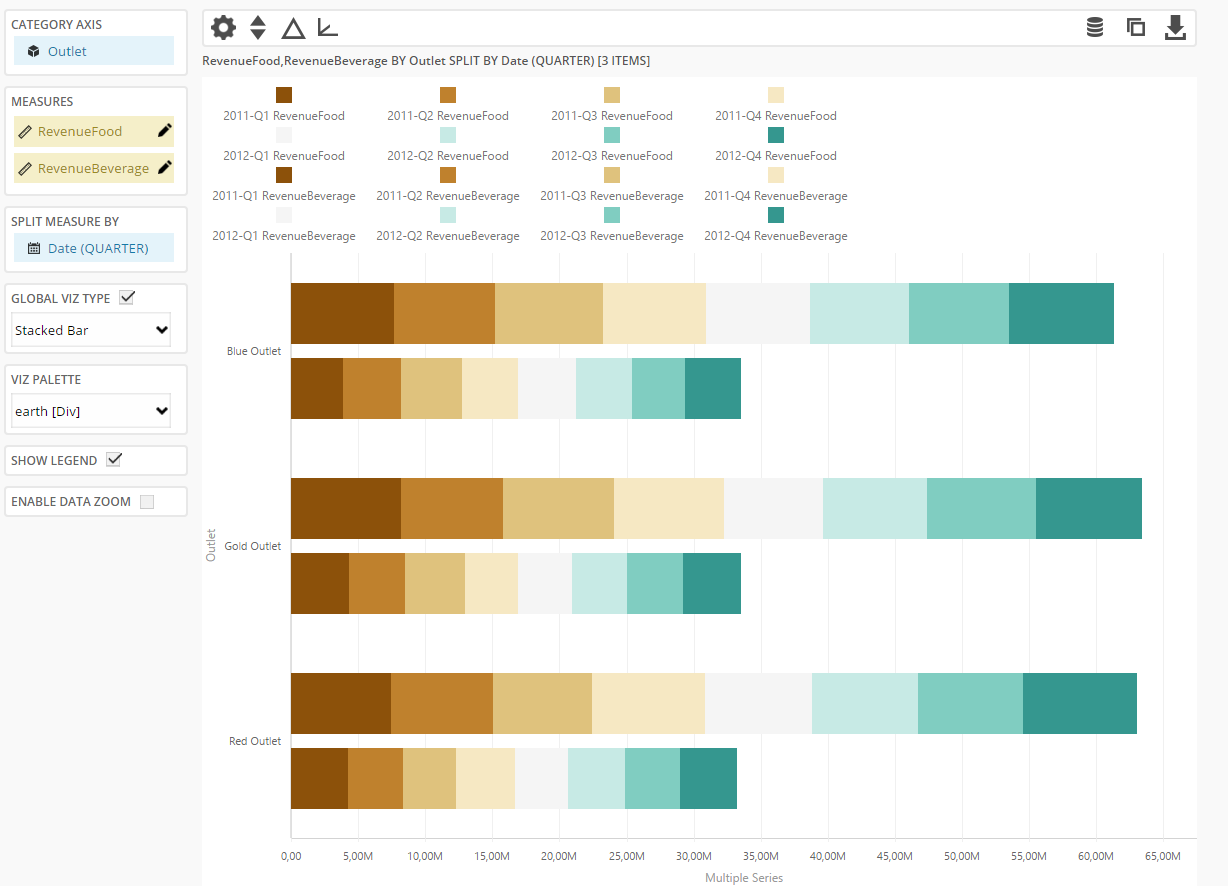
- Sequential and diverging palettes – primarily used to encode quantitative differences
We are developers of data visualization software BusinessQ. Try it for free and make reports and dashboards that makes sense, without chart junk.
Related posts