Whether the type of business you are in, customers are your backbone. Without customers, no…

Unsold items & how to find them in the Analytics BusinessQ app
We are all thinking about what we sell and which items are our top sellers, but do you know what is not selling? However, it is not all in what we sell; occasionally, it’s about what we don’t sell! How often do you wish to know what is sitting in your inventory? Not only sitting, but it’s also taking your money and space. From time to time, users ask us how to find out what is not selling or what are the worst-selling items.
Finding out what sells or doesn’t sell is extremely easy to find out using the Analytics BusinessQ app. Let’s explore it more deeply so you can find it out for yourself without any problem. For the reports we will present today, the Basic tier is enough. If this is usual for your business, here is essential information for you 😊.
You can find which items didn’t sell during some period in several Analytics app reports. To find out which report will give you precise information on unsold items, we recommend using Analytics Reports Vault. Here is an example of how you can search for a report that will give you specific information like Unsold items.
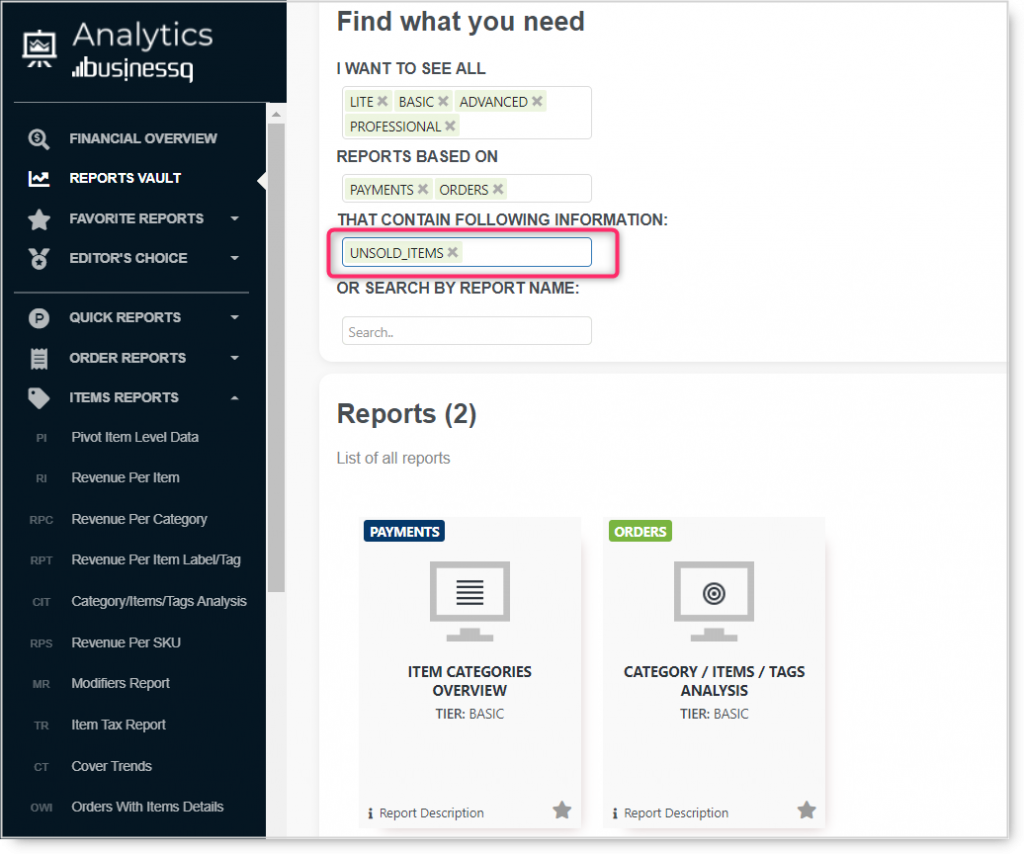
Let me present you with two reports that will show you all of your unsold items straightforwardly and directly. Those reports are:
- Item Categories Overview report
- Category /Items /Tag analysis
Item Categories Overview report
Item Categories overview report is a fast, payments-based report. Using this report, you can analyze data for up to one year. It could be the whole of 2021 but, as well, any period in the past that is no longer than 365 days. So, if you wish, you can look into data from any period since you have worked with Clover. Like all other reports, if you like the information and want to use it often, mark it as a favorite using a yellow star.
In this report, you can find all unsold items in a selected period. Like all Analytics tables, you can group data, filter it, or export it to excel.
So, how do you find which items were not sold?
- Open the Item categories Overview report (you can search for it in Reports Vault)
- The select period you want to analyze
- Scroll down to the bottom of the report > here, you will see Unsold items detailed table
In just two clicks, you can check out all of your not selling items. Maybe now is the time to get rid of it.
Data in the detailed table can be grouped by categories or quantity on the stock.
Item Categories Overview report is available in the Basic, Advanced, and Professional tiers of the Analytics BusinessQ app. Of course, this is not all.
Category /Items /Tag analysis
If you are interested not only in items that are not selling but would like to know which category or label they belong to, we recommend using Category / Items / Tags Analysis. This analysis is part of a Items reports section which means you will get detailed information about your items in question. There are two options to use in this analysis:
- to get information on unsold items,
- without information on unsold items.
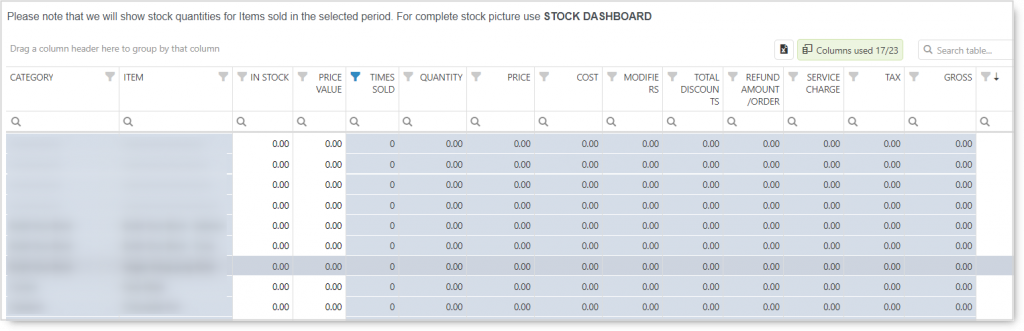
As here we are looking into finding out what was not sold in a particular period, let’s concentrate on the option with unsold items.
When this option is activated, you will see unique rows marked blue in all detailed tables available in the analysis. For example, if the item is marked blue, it was not sold in the period we are looking at. Use the funnel in “Times to select only 0 times sold items. Using this option, you will get unsold items per category and label values.
Category / Items / Tag Analysis Dashboard is a very convenient analysis. You can use it to determine which item categories are the best ones.
This Dashboard will inform you of all vital business aspects of your items, categories, and labels/tags.
As always, we want to hear any suggestions you may have. After all, we are building this app for you. Have any new ideas or suggestions? Write to us!
Happy Analyzing!
Your Analytics | BusinessQ App Team
Qualia Data Sciences LTD
Related posts


