Reports2Mail App FAQ

Basic information
What is R2M app for Clover?
Reports2Mail App provides detailed emailed reports and other business insights for managers and business owners – for all locations – in just a few clicks. It tracks how your business is doing, time trends, Key Performance Indicators, what helps companies to see otherwise hidden patterns, to spot business problems on time as well as to identify useful opportunities in their business data.
Reports2Mail App is a must-have reporting web app for Clover Merchant. It can be accessed on any device via a web browser, at any time.
„If You Can’t Monitor It, You Can’t Manage It“!
Installing R2M App
You can get Reports2Mail for Clover on Clover App Market here:
1. For US market: ![]()
2. For EU market: ![]()
How to: Install
To install Reports2Mail, go to Clover App Market, select Reports2Mail App and click on the INSTALL button
Choosing R2M App Tier
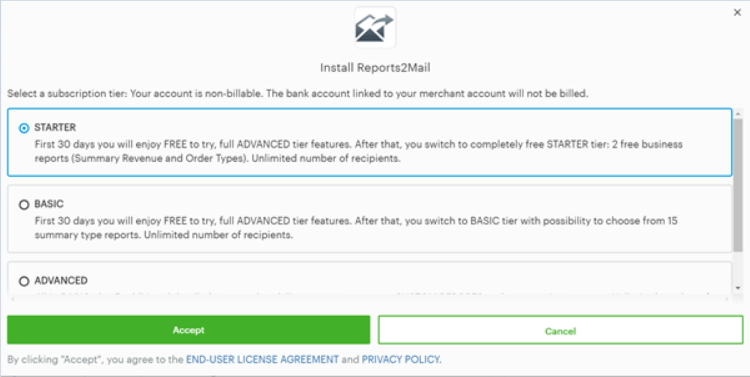
For all markets, Reports2Mail Application provides three Tiers (or Plans) that you can choose from.
- STARTER (Free)
- BASIC
- ADVANCED
TIER DIFFERENCES:
In the following table, you can see a list of reports that are available for each tier.
Besides the number of available reports, please note that the maximum period selection for reports in the Starter tier is only 1 day (yesterday)! In the Basic and Advanced tiers, you can access data for up to almost an unlimited number of days in the past (from the day you first use Clover).
Reports
Summary - Orders
Summary - Payments
Revenue per Employee
Revenue per Devices
Revenue per Order Type
Revenue per Tenders
Revenue per Day
Revenue per Hours
Revenue per Credit Card
Revenue per Categorie
Revenue per Labels
Revenue per Items
Stock Value by Categorie
Stock Value by Labels
Stock by Item SKU
Stock by Item Code
Payment Comparison Day vs Day
Payment Comparison Year-To-Date
Payment Comparison Month-To-Date
Payment Comparison Week-To-Date
Order Comparison Day vs Day
Order Comparison Month-To-Date
Order Comparison Week-To-Date
Order Level Details
Item Level Details
Max Orders
Max Payments
Max Orders/Items
Custom Order Level
Custom Item Level
LITE
-
-
-
-
-
-
-
-
-
-
-
-
-
-
-
-
-
-
-
-
-
-
-
-
-
-
-
-
BASIC
-
-
-
-
-
-
-
-
-
-
-
-
-
-
ADVANCED
Upgrading R2M App Tier & Free Trials
If you want to upgrade or downgrade to any Reports2Mail Tier, you can do it easily from your Clover web dashboard.
- Login into Clover web dashboard and go to Clover App Market or press GET MORE APPS button on the right side of the dashboard
- Once you are on App Market page, click on ‘Installed Apps‘:
- Select Reports2Mail by Qualia app and on the right side, you would see Change subscription button:
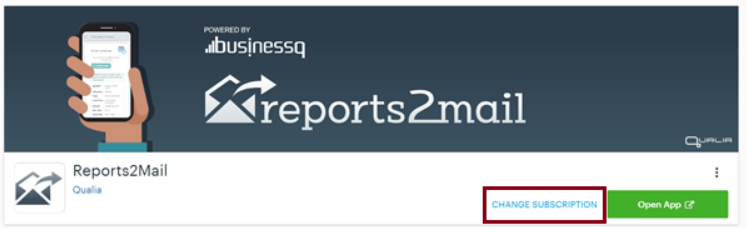
- Clicking on that button you would be able to change Reports2Mail Tier:
Once you upgraded to BASIC or ADVANCED tier, make initial login to Reports2Mail App.
Free trial and billing
The first time you download and install any tier of Reports2Mail App you will enter a 30-days free trial on Reports2Mail Advanced tier. During this period, you will not be charged and you will have access to all of our reports. At the end of 30-days free trial, you will be reverted to originally chosen tier and charged for it (if you selected the STARTER tier you won’t be charged anything since it is free tier). If you uninstall the Reports2Mail App before the trial expiration date, you will not be charged anything.
A free trial is available only within the first 30-days of installing the Reports2Mail App. For example, if you installed Reports2Mail five days ago and now you wish to try out Basic tier, from the moment you start Free trial, you will only have 25 days of free trial left.
Note: STARTER Tier Reports2Mail is always free, but with limited selection of available reports.
Canceling subscription after passing of the free trial period
Subscription can be canceled anytime via the Clover app market. In that case, you will be refunded for the amount of time you didn’t use Reports2Mail. Example: You installed Reports2Mail App and a free trial is now over. You get charged for the next month. You wish to continue using it for another week. After that week you wish to cancel. You will be charged only for that week, and you will be automatically refunded the rest of what you paid for the whole month (in this case you will get ¾ of the whole month amount refunded).
Uninstalling R2M App
How to: Uninstall Reports2Mail App
As we are 3rd party developers for Clover and we can’t neither install nor uninstall Reports2Mail App for you. You will need to do it yourself by going to the Clover dashboard.
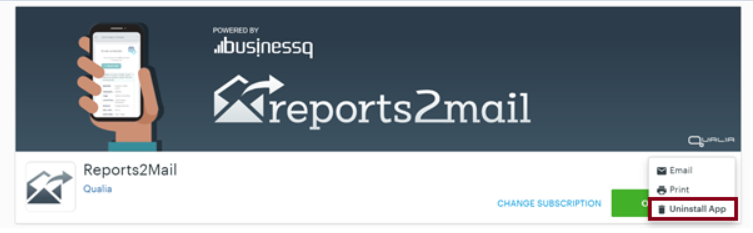
In Clover Dashboard go to More Tools/ Installed Apps. Find Reports2Mail app, and in the right corner click on the icon with three dots. After you clicked on three dots icon, you will get to the option to Uninstall App. From the list of available options, select the option “Uninstall App”.
Welcome Screen and its Settings
Dashboard
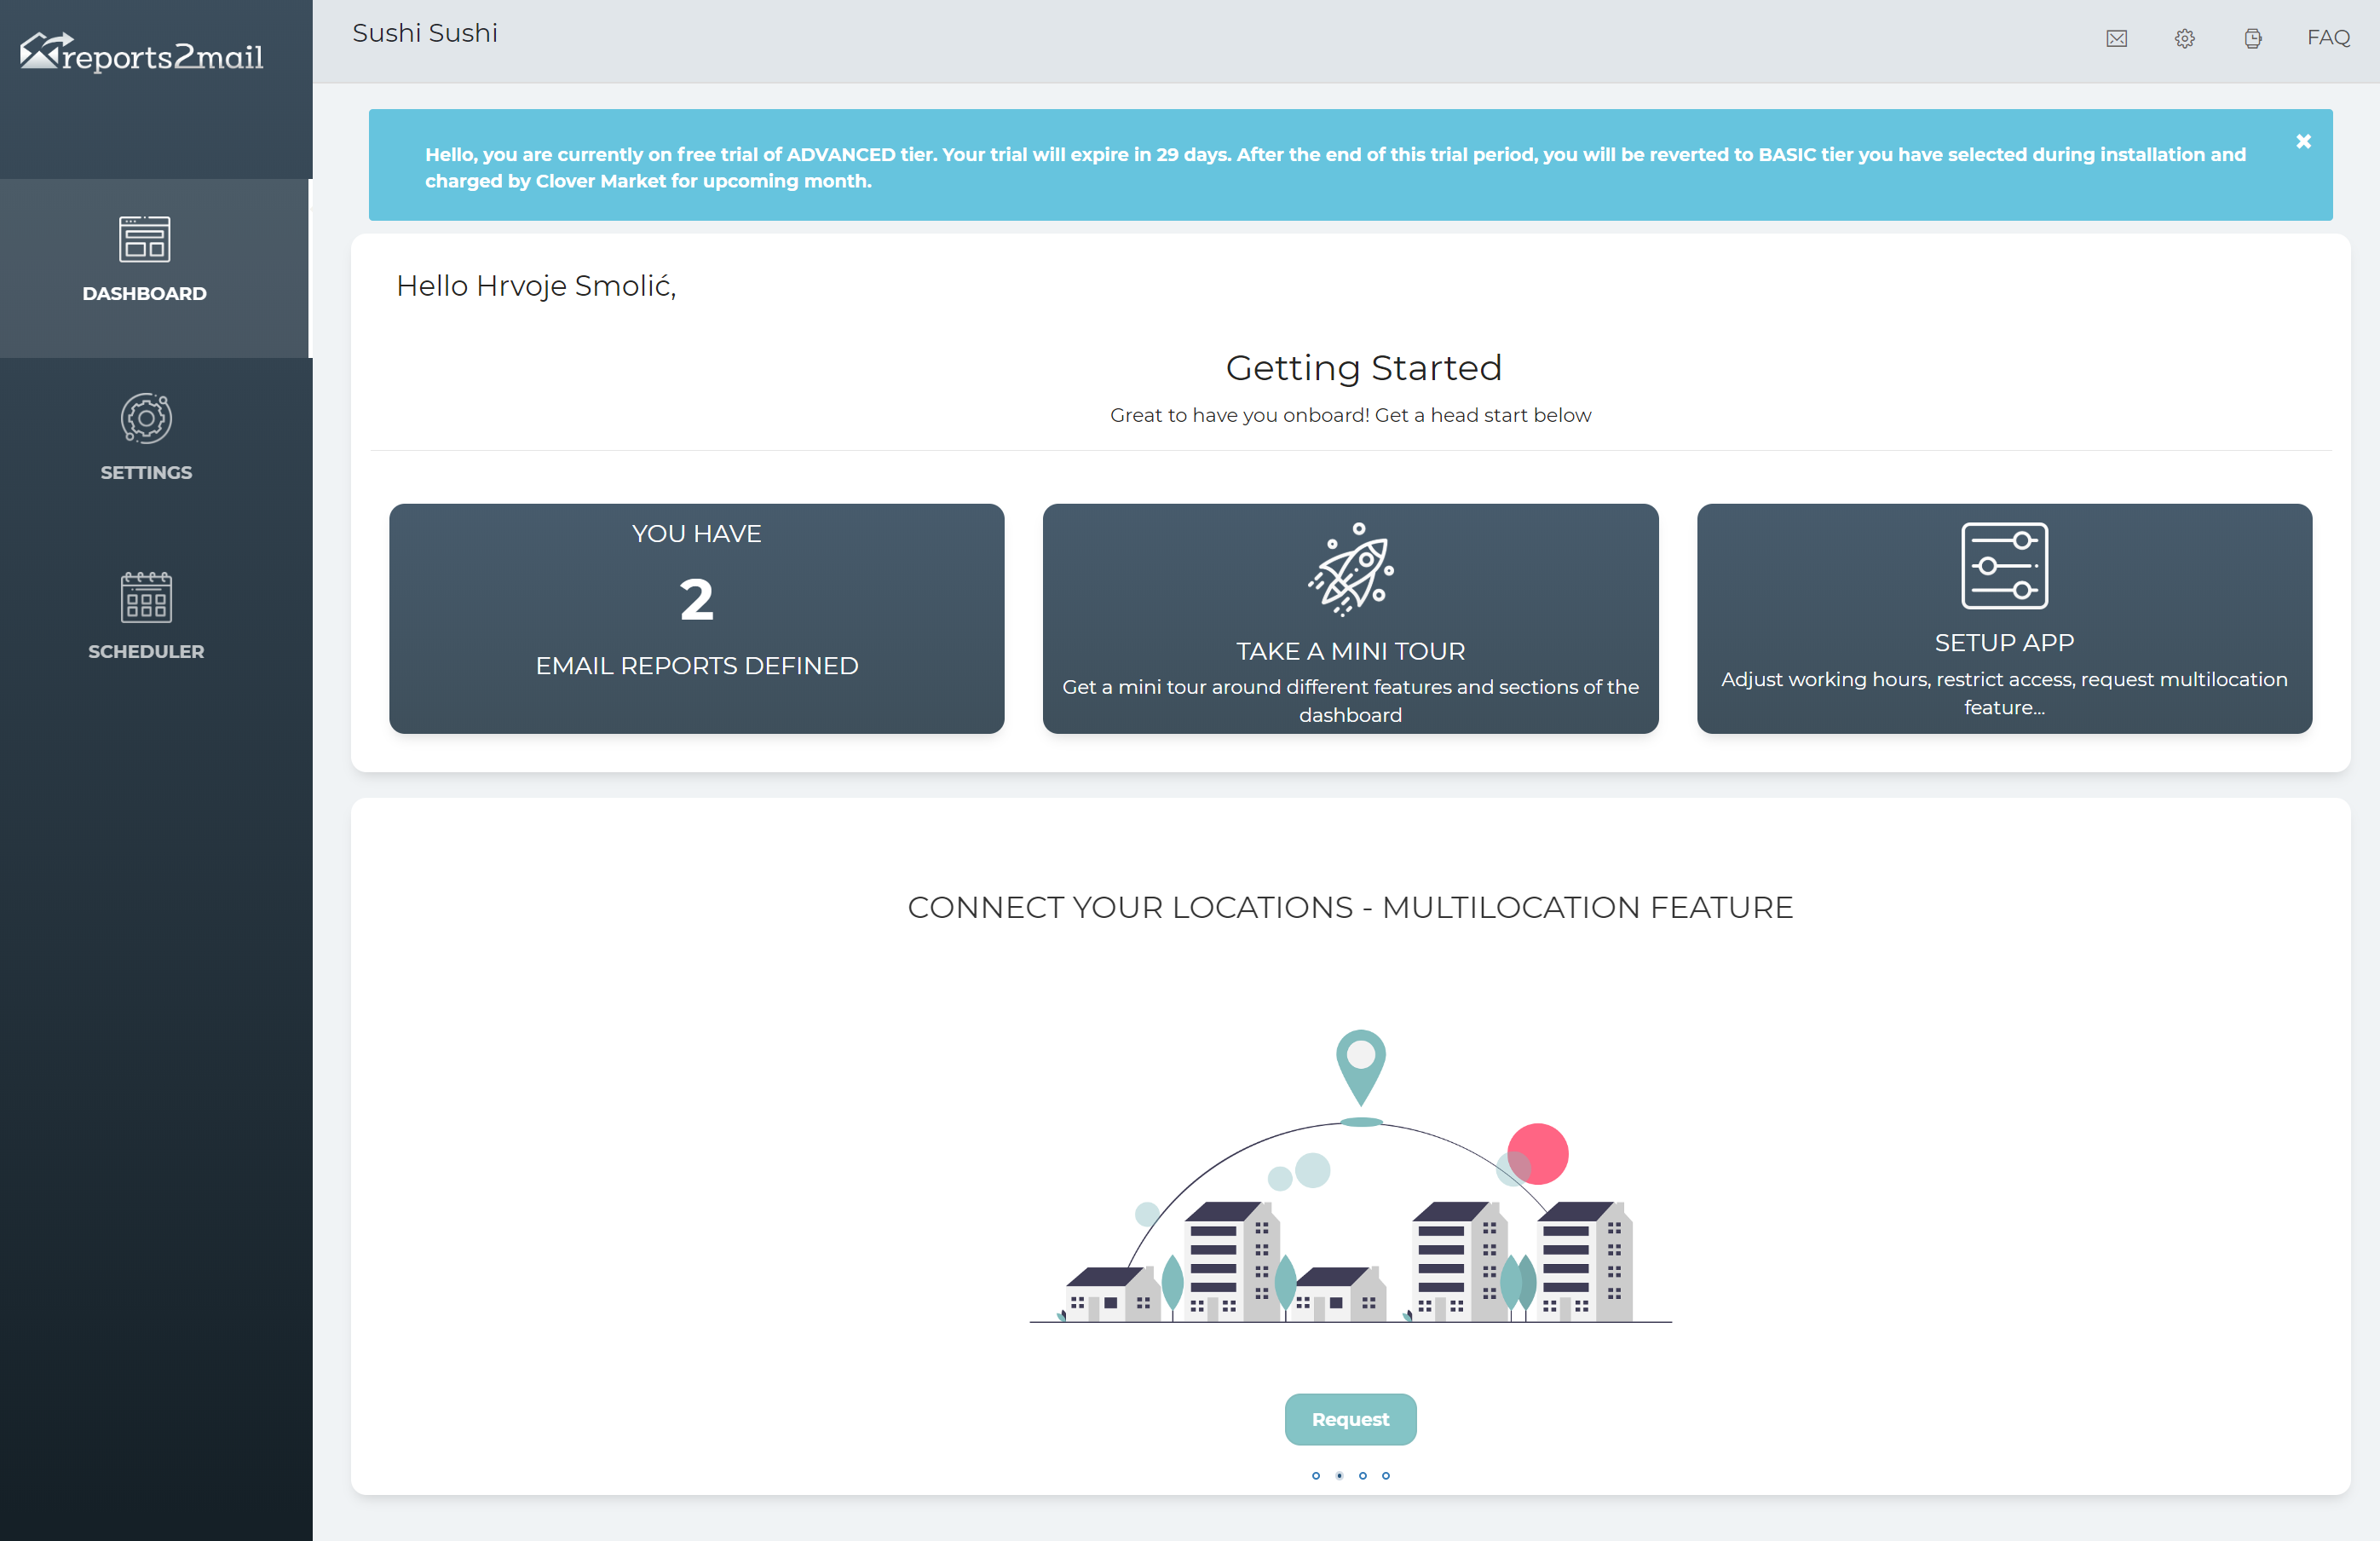
The Dashboard page gives you a preview of a few important information in your Reports2Mail App. On the Dashboard, you can see how many reports you have already prepared. From the Dashboard, you have direct access to the Setup App section. There is a Carousel where you will find some interesting additional information. Here you can click on an icon and send us how you feel about the App. Besides that, in the menu bar, you can see several icons that will give you options for contacting us or will lead you to the FAQ page.
On the Dashboard, you have access to the Reports2Mail app “mini-tour”. We advise all users that after installing the application, take this quick mini-tour. It will give you short info and guide you through the app.
In the next couple of sections, we will explain how you can customize settings for your needs, how to use multi-location settings and of course all reports that you can choose from and prepare for receiving regularly to your email.
Settings
In the Settings section, you can find several pieces of information about your account.
Here you can find sections like “General Settings”, “Your account details” and the part about “Multilocation”.
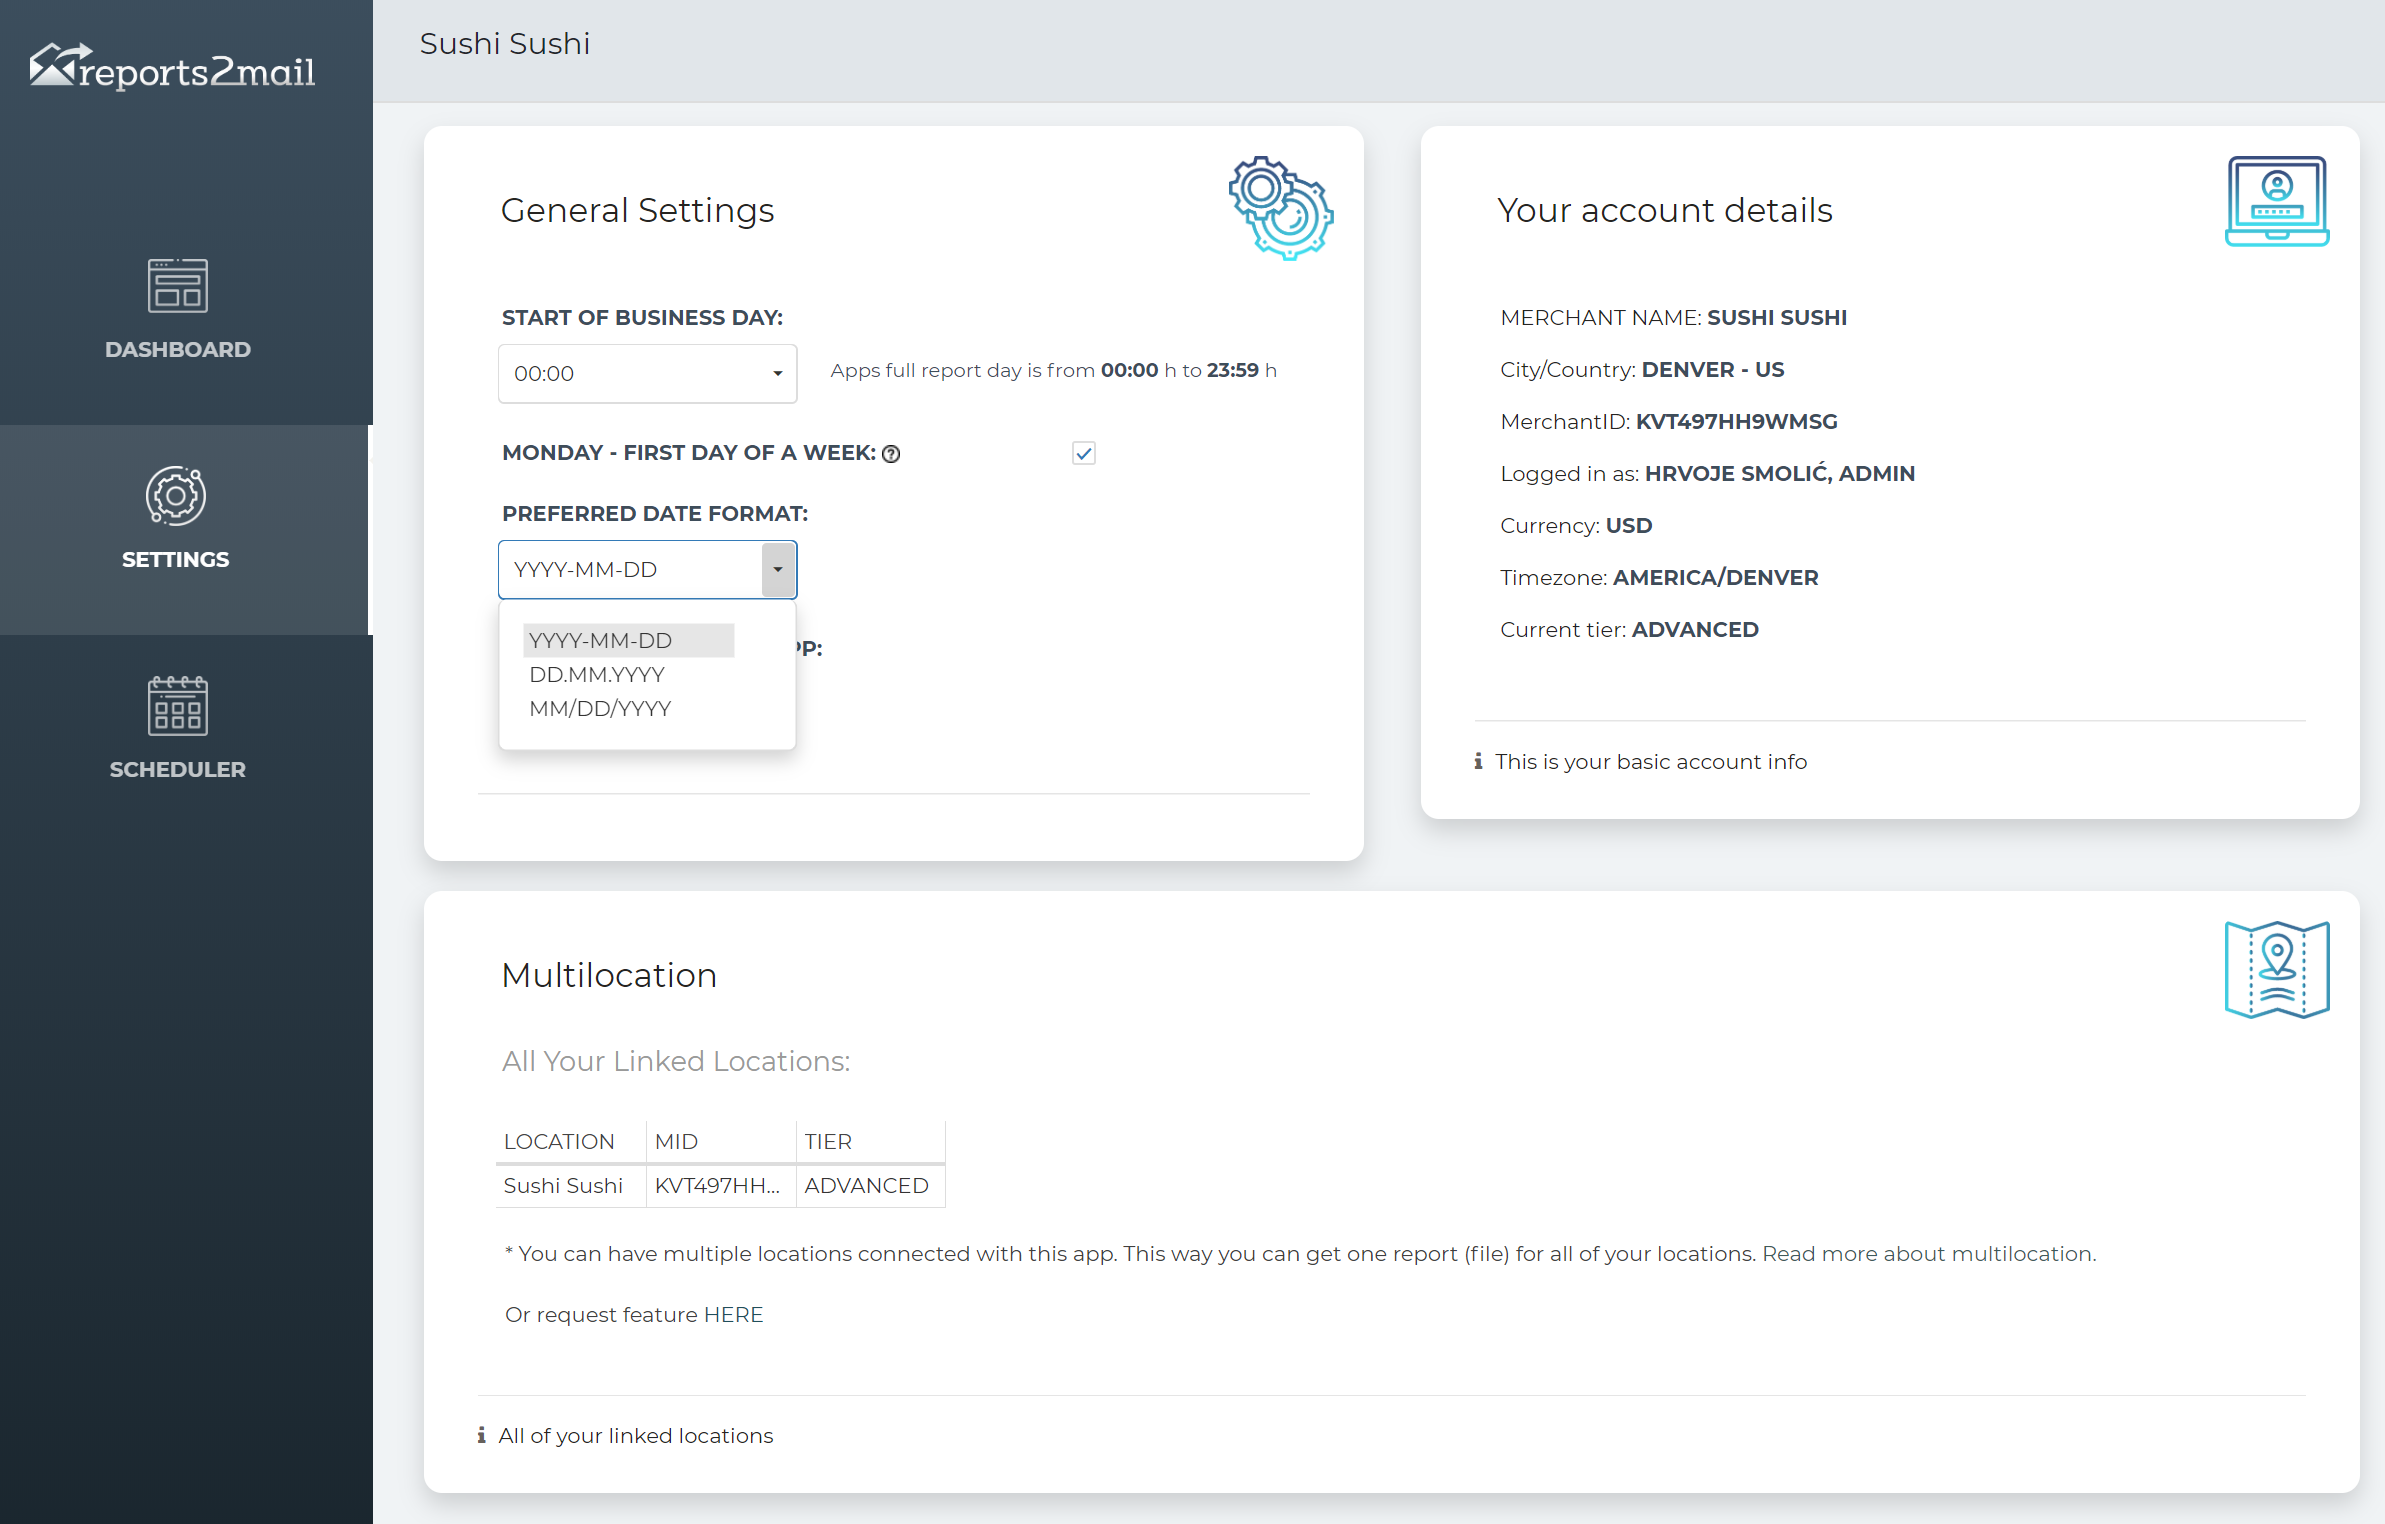
General Settings
In the Settings section, you can find General Settings, where you can define several things as listed under.
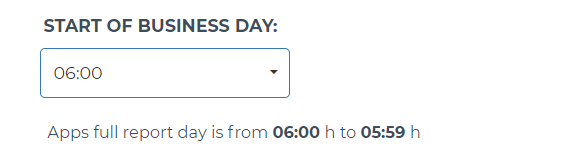
Business Day – here you can set when your Business day starts. As soon as you selected the starting time of your business, Reports2Mail App will recalculate your total working hours. Example: if you define, 6 am (6:00), your working day in Reports2Mail App will be from 6 am (6:00) until 5.59 am (5:59) the next day. This is very convenient for businesses that work after midnight. In that way, in reporting, you will have exact information about how your business was doing on a particular day (regardless of calendar day)
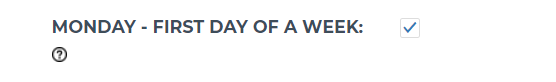
Monday – first day of a week – In Reports2Mail App, a week can start with Sunday or Monday. If you uncheck Monday as the first day of the week, Sunday will be set as the first day of the week instead. This change affects the ‘week’ column in reports.
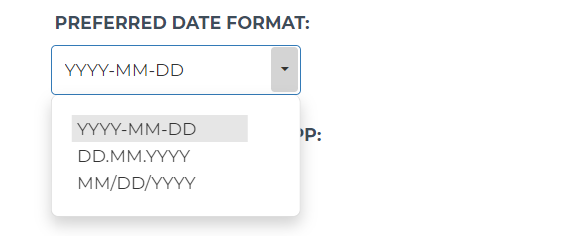
Preferred date format – In Reports2Mail App you can choose what is your preferred date format. There are three options that you could choose from YYYY-MM-DD, DD.MM.YYYY OR MM/DD/YYYY. Just click on the one you wish to use.
Security Settings – here we will show the list of all roles that we have found defined in the Clover for your particular merchant ID:

For security reasons, you will not be able to exclude your own role. Also, each person will be able to exclude only those roles that are less restrictive from the current employee’s role. For example, a person logged in with role EMPLOYEE, will not be able to deselect role ADMIN. On the other hand, a person with role ADMIN will be able to deselect role EMPLOYEE.
Saving changes – in general settings, every time you click on one of the offered checkboxes, you will get a small notification that is telling you that the changes are now active:

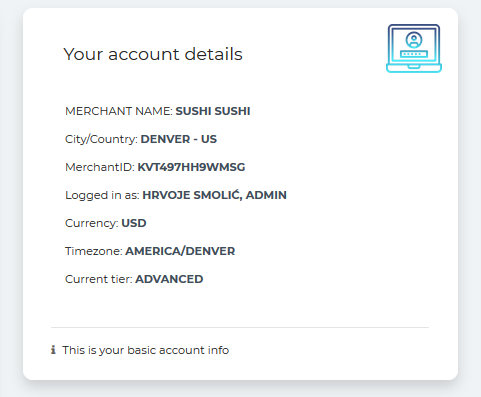
Your account details
In the section “Your account details” you can see basic information about your account, like your Merchant name, City, Country, MerchantID, Currency etc. Information listed here is not editable, there is no possibility to change them in these sections.
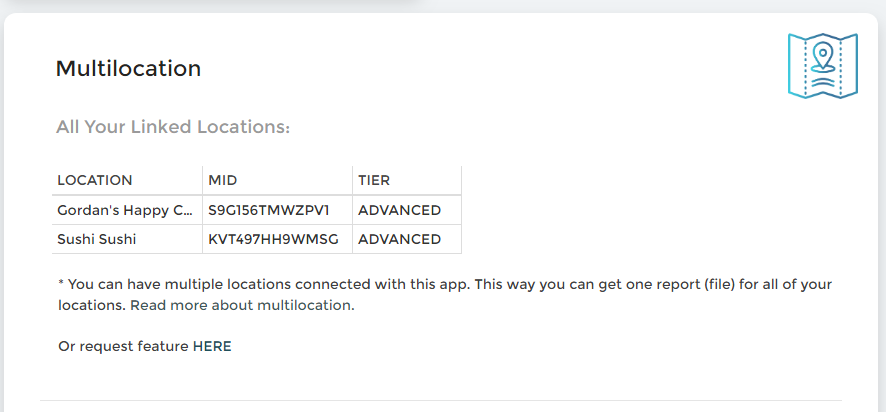
Multi-location feature
Under section “Multilocation“, you can find the list of all Merchant IDs (all Merchant Locations). If you only have one location, this location will be listed here. In case we have linked more of your location with a multi-location feature, all linked locations will be listed here. By default, you will be able to see only Merchant/Location you Log in with.
If you are the owner of multiple Clover Merchants/Locations, and you want to get reports for all their data in one reports, please do the following:
- Install at least BASIC Tier on all your Merchants from Clover App Market and make initial login to Rerorts2Mail App
- Please contact us via email ‘reports2mail@qualia.hr’ with multi-merchant setup request (just give us Merchant IDs of locations you want to have Multilocation feature)
Upon receiving your mail, we will set up a Multi-Location environment for you in one business day. After the multilocation feature is installed you will receive our confirmation email.
What will you get with it?
After all your locations are linked with a multilocation feature, you will be able to choose any or all locations in reports that you will set up for receiving via email. It means that, for each report, you can choose one location or more that this report will be for. This is totally up to you when setting up each report. To set up reports, please follow the instructions available here.
Scheduler
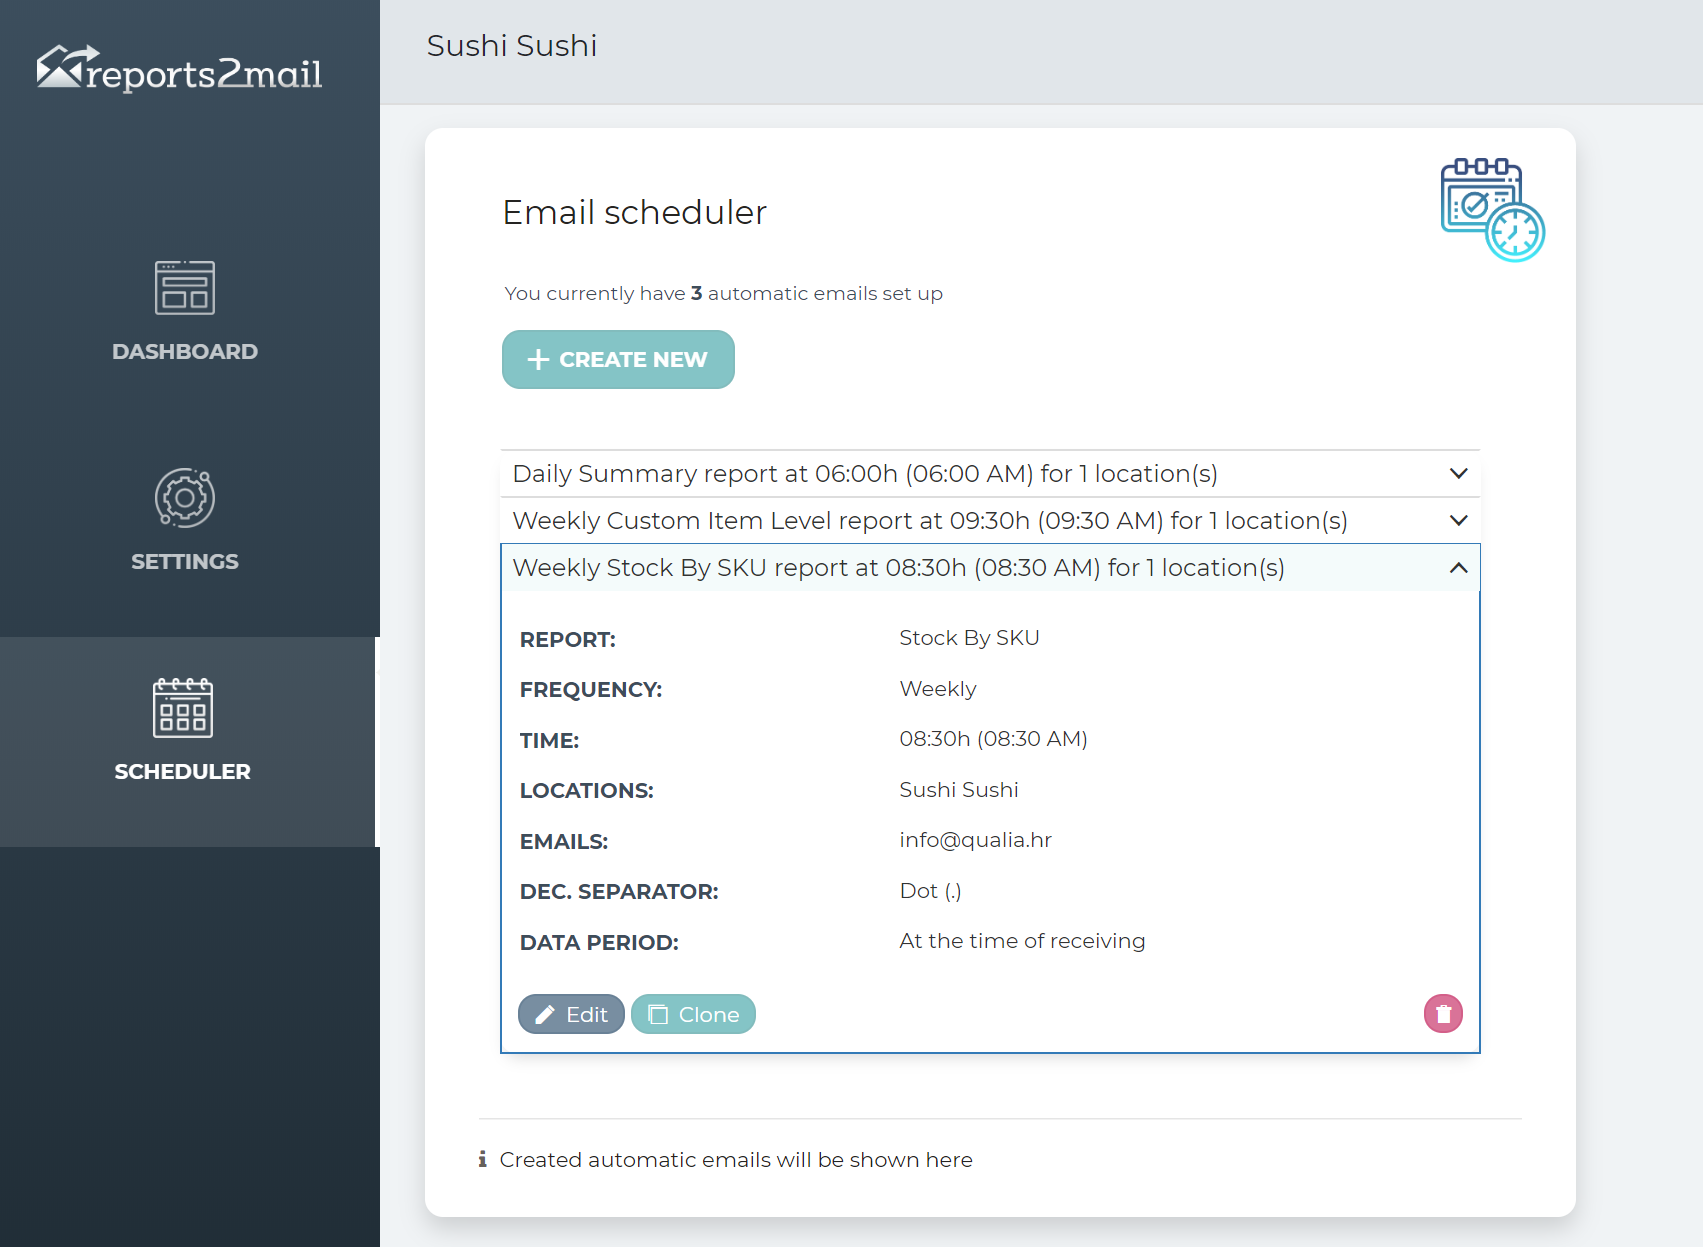
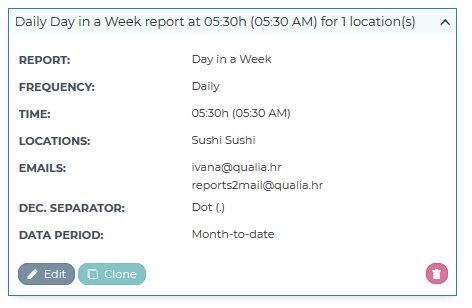
“Scheduler” section is the “motor” of Reports2Mail application. Here you will define each new report that you wish to receive to your email. Besides creating, you will see all already defined reports. All already defined and prepared reports, you can clone, edit (change name, add new email addresses), or just delete it.
When you open the Scheduler section, you will see all the reports that you have active at this moment.
Creating new report
Creating a new report
There are several steps that you need to go through in defining a new email report. A setup wizard will guide you until you finish it.
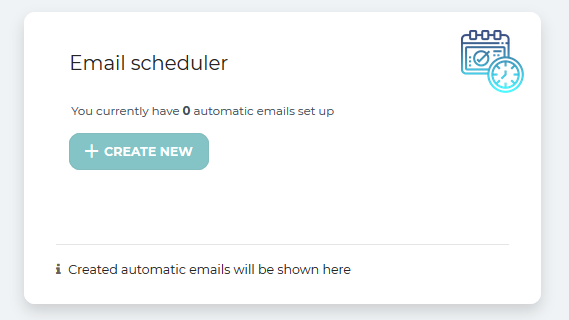
Click on icon “+ CREATE NEW“. This icon you can find on the main page of a Scheduler section. This icon will always be available, regardless of how many email reports you already defined.
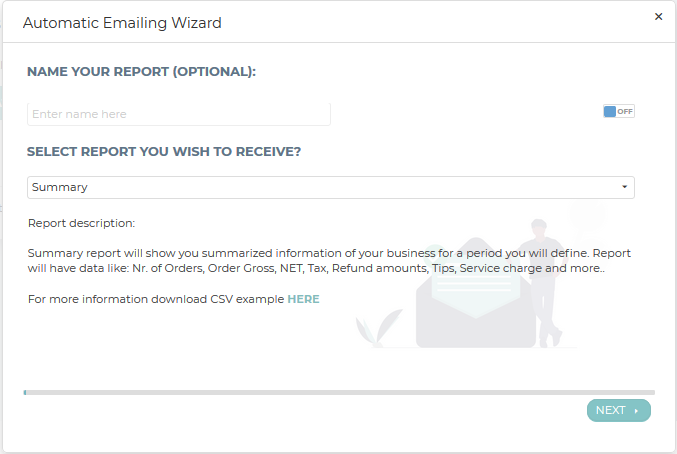
Step 1. – Choosing a report you wish to receive
In step one, you need to choose a report that you wish to receive your email. Besides predefined report names, there is also an option to give your own name to each email report. If you do not define a specific name, a default one will be used.
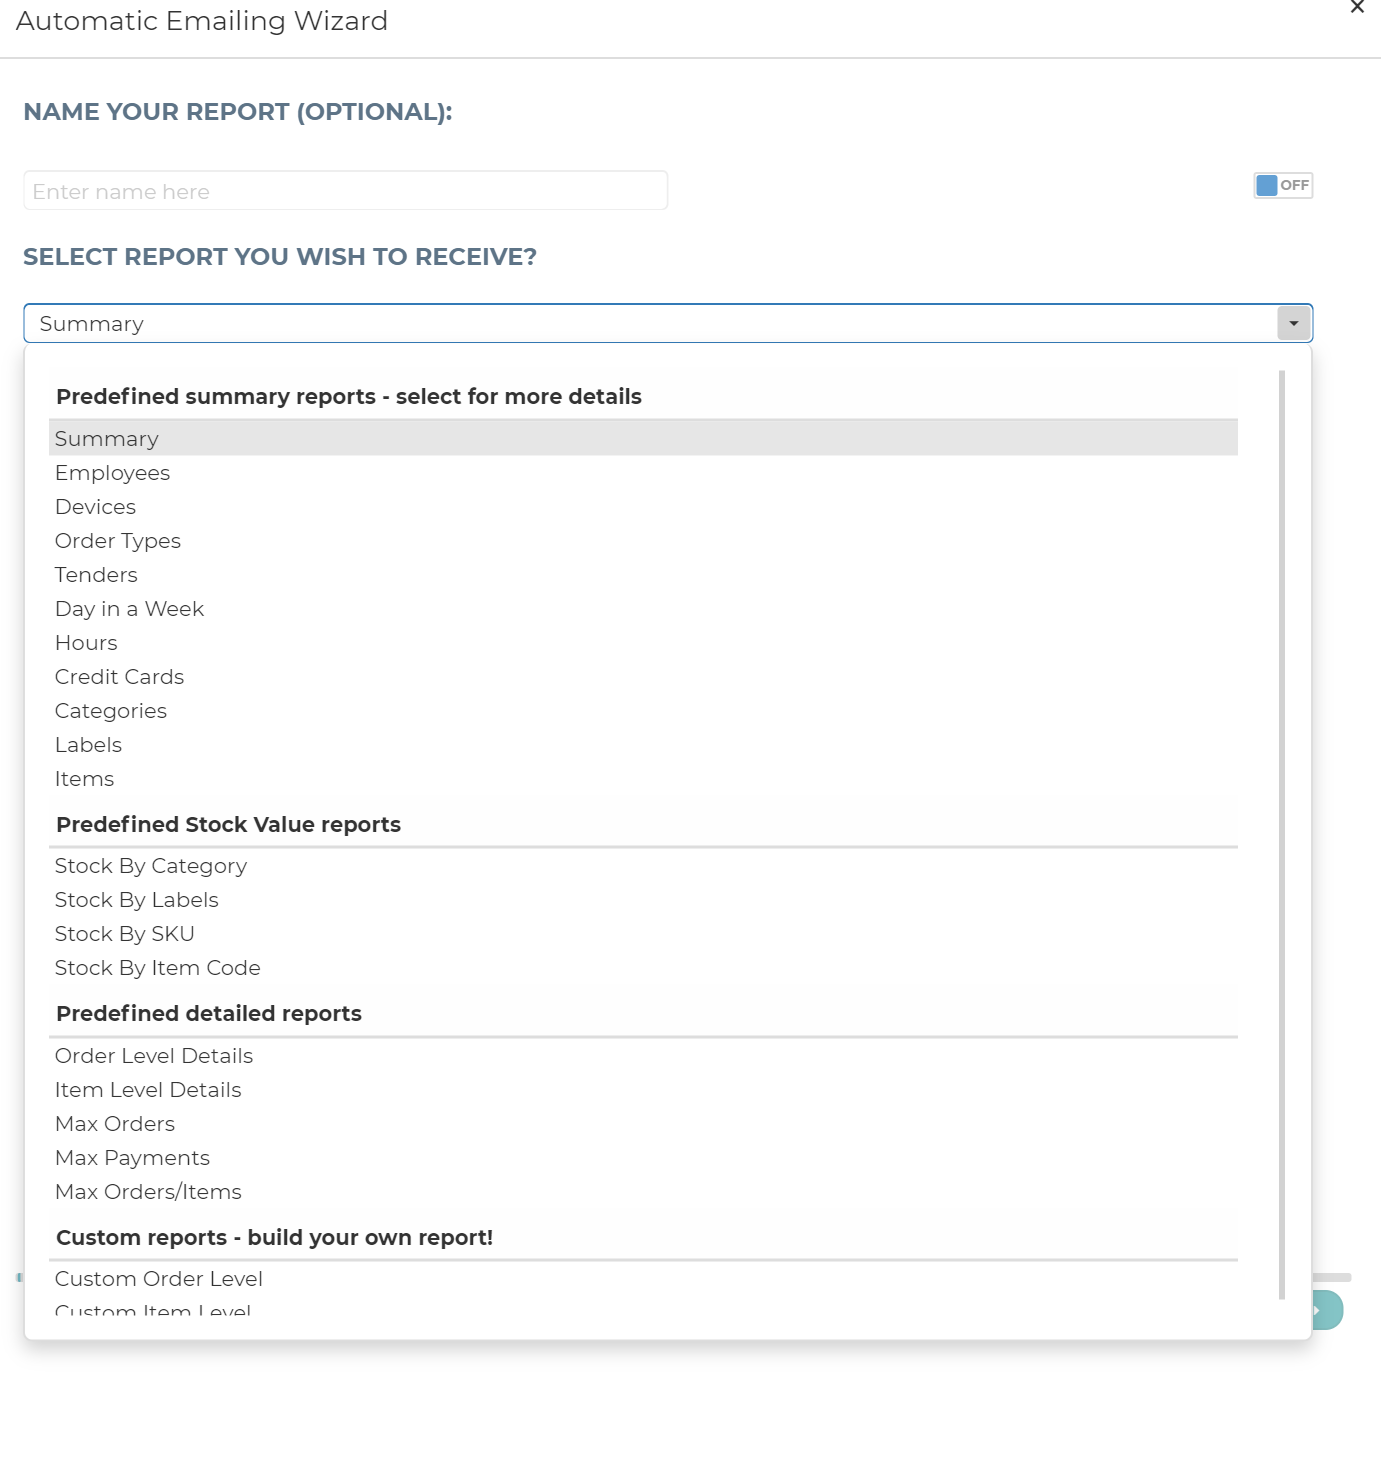
Clicking on the arrow in the box under “Select report you wish to receive”, a list of all available reports will appear. From the whole list of reports, you will be able to choose reports depending on the tier you are using. Reports that are not available in your tier will be grayed out. The whole list of available reports per each tier you can see here.
Step 2 – Location(s) for your report
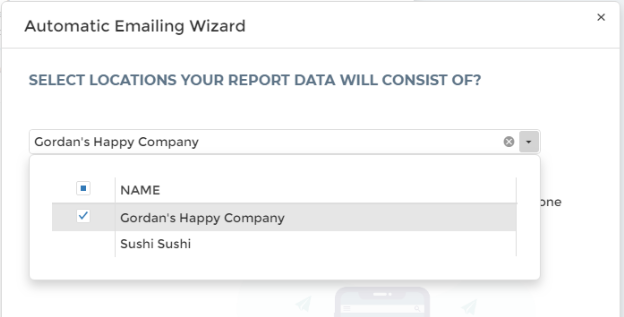
In this section, you need to choose for which location you wish to get a report for. Your location will always default and you will see it in the box. In case you have only one location, in this step, you don’t need to do anything, just click on “Next” button.
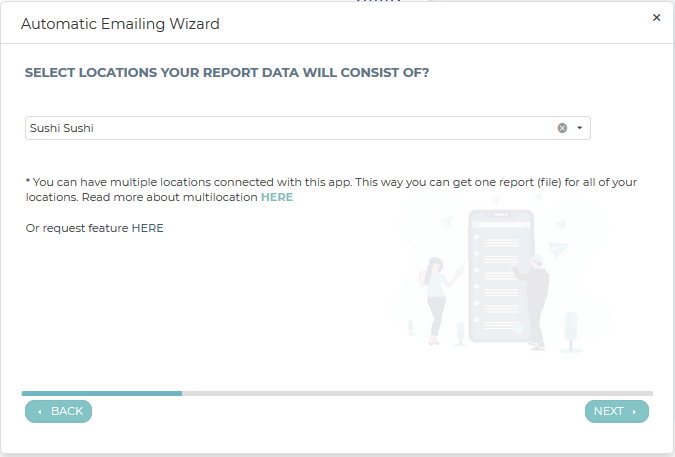
In case you have more locations that are using Reports2Mail App and they are already linked with the Multilocation feature, when setting up reports, you can choose for which location you want a particular report. When you open a location name box (click on the arrow on the right side), all connected locations will be listed. Please choose all the locations you want to get data for in a particular report. It could be only one, some or all of your locations.
If you have more locations, and you wish to connect all your locations with the multilocation feature, please follow the steps described in the article about multilocation that is available here.
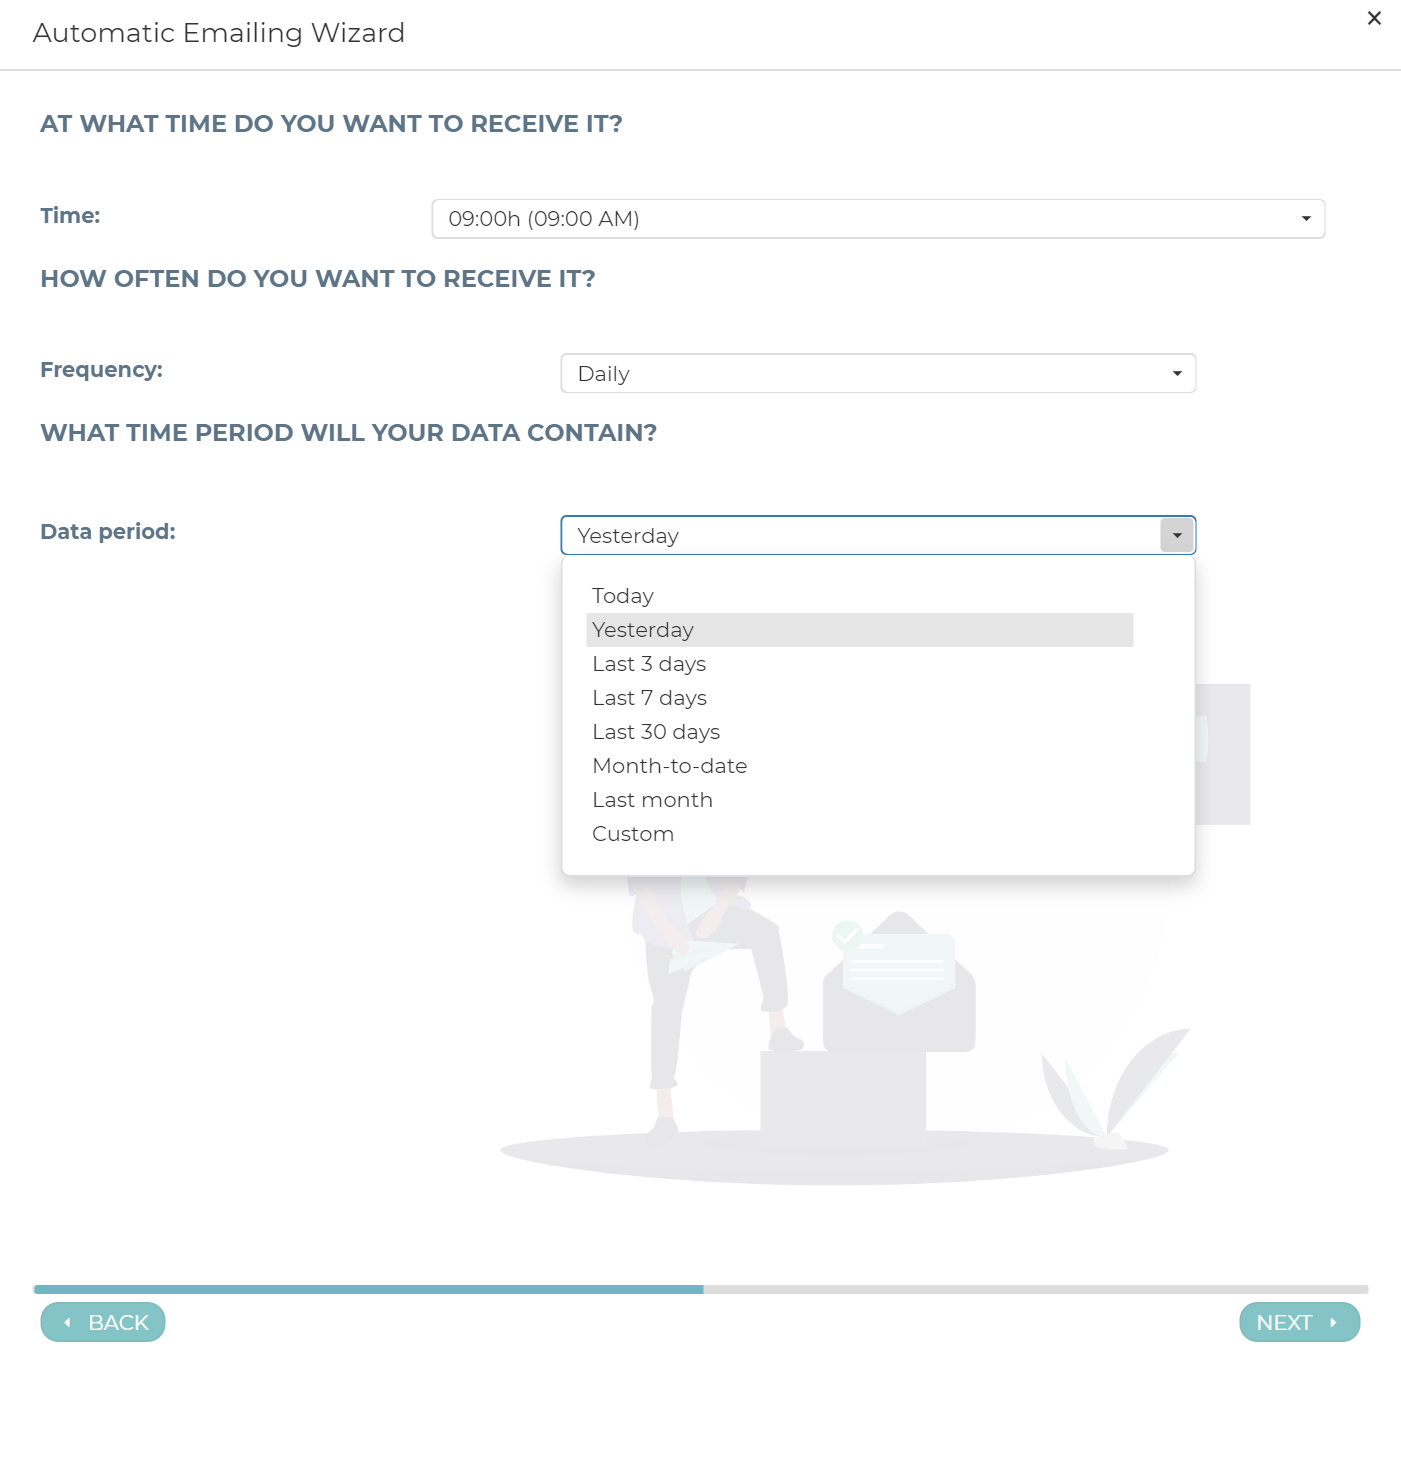
Step 3 – Time, Frequency and Data period set up
In step three, you need to define several things like time, frequency and data period.
Time: time of the day when you will receive a report to your email. When opening the time box, you will see a list of all available times. Time to receive stars at midnight (0:00 am) followed by every 30 minutes choice. Chose one that suits your needs.
Frequency: in the frequency, you define how often you will receive reports. Predefined frequencies are Daily, Weekly and Monthly.
Data period: In the data period you define the period for data retrieving. This is a very important step because even a time of receiving a report can make a difference in data that you will get. The data period is connected to time you are receiving reports, but as well as how you defined your business day. Available data periods are:
- Today
- Yesterday
- Last 3 days
- Last 7 days
- Last 30 days
- Month-to-date
- Last month
- Custom data period (how to set up find here)
If you are already using our app Analytics, you will notice data periods are the same. From the name of the data period, you can conclude what data you will receive.
Example – You define to receive reports daily for data period today. Your business day starts at 8 am. Depending on time you will receive a report, your report will contain data for a period of none, one or maybe several hours.
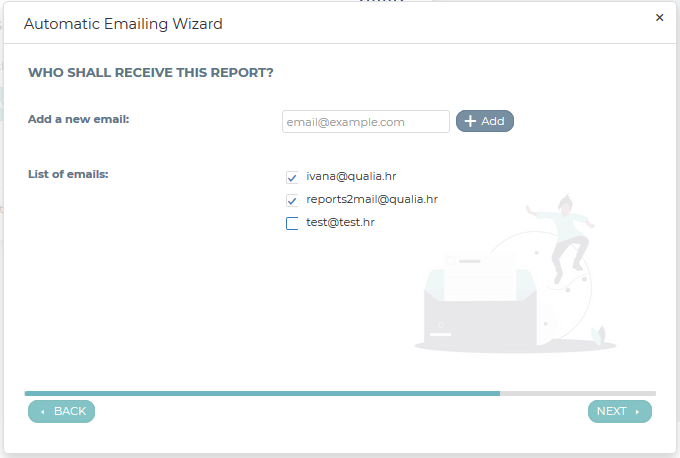
Step 4 – Recipients of reports
In step four, you need to define who shall be receiving the report that you have prepared. There is no limit on email addresses for receiving reposts. When you are in this step if the mail you wish to receive. When you added all email(s), just click on icon “Next“.
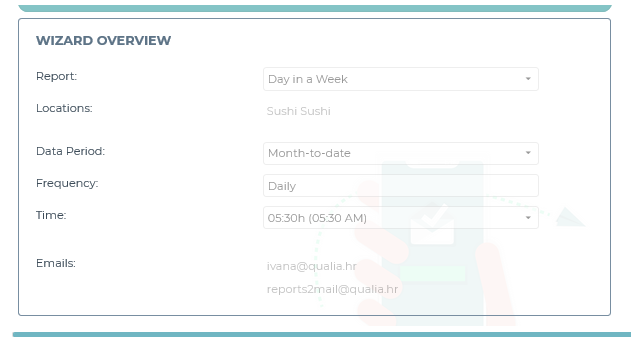
Step 5 – Report overview
In the last step of the report setup, there are several options. Before you save this report wizard, you can check what you choose in the Wizard overview or send a test mail. If you are satisfied with the setup, you can save it.
Report format
In the last step, you can choose in which format you want to receive this report
- Excel (predefined)
- CSV (comma separated value)
If you choose to receive CSV format, depending on a market you are coming from, you will have defined decimal separator either dot (.) for the US market or comma (,) for the EU market)
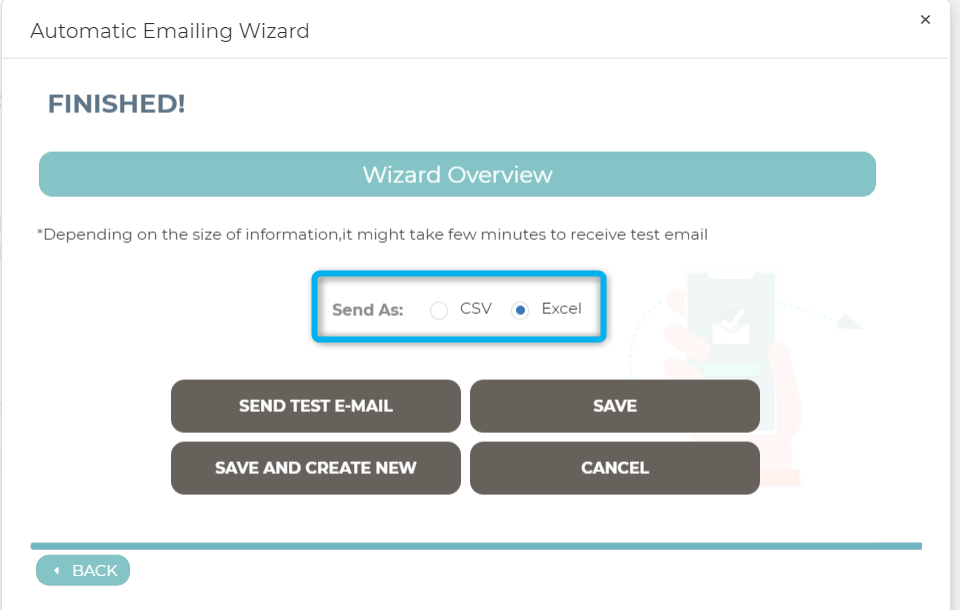
After defining the report format to be sent to your email, there are several options to choose from:
- Send test e-mail (test example will be immediately sent to your email)
- Save
- Save and create new
- Cancel
Editing prepared reports
If you want to make changes in reports you already defined, this is very easy.
In the main Scheduler page, click on the report that you want to edit, clone or delete. For editing, click on the “Edit” icon and basic information on the prepared report will open. If you want to change the name of the report you can do so by clicking on the icon “use custom name” and put a value on “ON“. Enter the name you wish and save changes. Except for name change, here you can do all other changes as well like frequency, time of receiving, data period, or even add or remove email addresses.
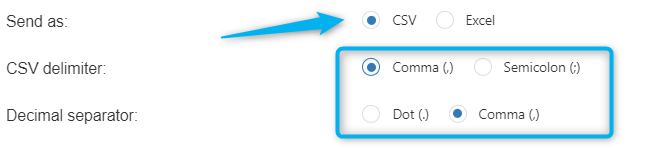
For each e-Report, you can change format of the report. You can choose from two types of formats
- Excel (predefined)
- CSV (comma separated value)
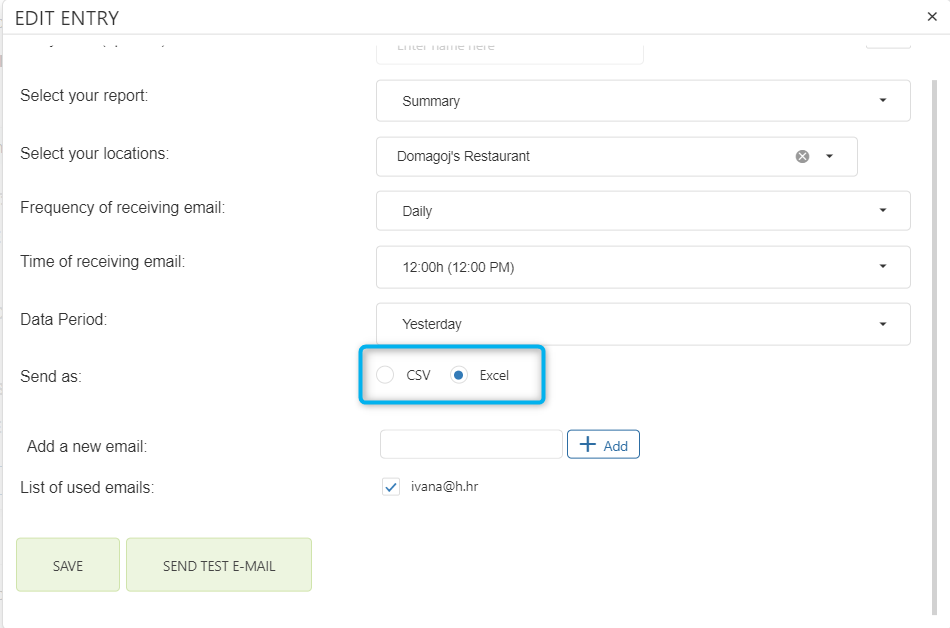
Besides changing between Excel and CSV, you can change the decimal separator in CSV files as well. The decimal separator is predefined by the location you are coming from, the US market (dot), EU market (Comma). If you prefer to use different separators you can do so as well. To do that, just define CSV delimiter and decimal separator of your preferences.
Except for editing, any earlier prepared email reports, you can clone or delete the report. To do so, just click on the icon for this action.
Reports2Mail App and available reports
In this section, we will explain all reports that are in this moment available in the Reports2Mail App for Clover. List of all reports and availability per tier you can check here.
All reports are divided into several main groups:
Predefined summary reports – in this section, there are several reports that give you overview information on how your business was doing but depending on the type of the report. Here you can choose from reports like Summary revenue, Summary pre Employee, Summary per Device, Summary per Tenders and many more.
Predefined comparison reports – in this section, there are several predefined reports that you can use to compare values from this year to values from the same period last year. Periods are predefined, therefore it is very easy to create those reports.
Predefined stock value reports – this type of report will give you several views on your current stock count. These reports are always giving you information about your stock at the moment the report is created. Here you can choose from reports like Stock value per Category, per Labels, per Item SKU or per Item Code.
Predefined detailed reports – predefined detailed reports are reports where you will receive many more pieces of information than in summary reports. Here you can choose to get reports with detailed information about orders, about items or combined.
Custom reports – custom reports are reports where user-created data as they want to see in each report. They are based on a pivot table where the creator prepares data as they need it.
Summary reports
Summary Reports are reports that in a simple and clear way give information on different categories and associated data. In the summary section, you can choose reports that will give you data on Summary Revenue, Employees, Order types, Tenders, Credit cards, and some others. All reports available in this section are listed below. Reports values will depend on a period you have selected to get data from but as well on time, you will receive a particular report.
Summary reports facts:
- Order based reports
- Very fast report
- Less detailed reports
The difference between Summary reports and Detailed reports is in the level of details/information that can be provided. Basically, Summary reports can have a bigger period of time selected but are less detailed. The idea of Summary reports is that you in a simple view see the most essential information for your business.
In the next sections, you can read more about available Summary reports. Each of them you can prepare to receive via email, in all available frequency or time receiving. We prepared reports, you define the report period and frequency of receiving each of them.
Each report you can receive in excel or in CSV format. If you choose to receive CSV, depending on the market you are coming from, you will have a defined decimal separator either dot (.) for the US market or comma (,) for the EU market.
All available reports can be found under the menu Summary Reports. Just select one you would like to receive to your email(s) by clicking on its name, as shown in the picture below:
REVENUE SUMMARY REPORT – ORDERS
A revenue summary report will give you basic and overview information on how your business was doing in a selected period of time. Data you will have in this repots are a number of orders, orders amount NET, order amount gross, refunds, taxes and tips, and a few other values. If you will prepare one report for all locations, in one report you will see listed all locations together with all needed data.
Here is an example of a report that you would receive – download one for your market and check all available data.
CSV example (US), CSV example (EU)
SUMMARY REPORT – PAYMENTS
A revenue summary report will give you basic and overview information on how your business was doing in a selected period of time with a focus on payments. Data you will have in this repots are a number of payments, payment amount, taxes and tips, and a few other values. If you will prepare one report for all locations, in one report you will see listed all locations together with all needed data.
Here is an example of a report that you would receive – download one for your market and check all available data.
CSV example (US), CSV example (EU)
REVENUE PER EMPLOYEES REPORT
Revenue per employee report will give you basic and overview information primarily on how employees were doing in a selected period of time. Data you will get are employee names and ID numbers, how many orders they made, what was total order amount, tips, and some others.
Here is an example of a report that you would receive – download one for your market and check all available data.
CSV example (US), CSV example (EU)
REVENUE PER DEVICES REPORT
This report will show you summary info based on your devices. If you prepare a report for more locations, you will see all the locations and all devices in the same report. In the report you will get the following information per each device: Number of Orders, Gross, Tax, Refund amounts, Tips, Service charge, NET and more…
Here is an example of a report that you would receive – download one for your market and check all available data.
CSV example (US), CSV example (EU)
REVENUE PER ORDER TYPES REPORT
The order types report will show you summary info for all order types you defined in Clover. You will see the following information per each order type: Number of Orders, Gross, Tax, Refund amounts, Tips, Service charge, NET, and more…
Here is an example of a report that you would receive – download one for your market and check all available data.
CSV example (US), CSV example (EU)
ORDER TENDERS REPORT
This report will show you summary info for all tender types that occurred and that are associated with orders created in a particular period. In this report, you will see the following information per each tender type: Number of Orders, Gross, Tax, Refund amounts, Tips, Service charge, NET, and more… In case of split payments, use the Payment Tenders report, since payments per tender can’t be calculated correctly when data are taken from orders.
Here is an example of a report that you would receive – download one for your market and check all available data.
CSV example (US), CSV example (EU)
PAYMENT TENDERS REPORT
This report will show you summary info for all tender types based on payment data. In this report, you will see the following information per each tender type: Number of Payments, Payment Amount, Tax amount, Credit amount, Tip, and more … If you want to know payments per tender and you have split orders payments, use this report.
Here is an example of a report that you would receive – download one for your market and check all available data.
CSV example (US), CSV example (EU)
REVENUE PER DAY IN A WEEK REPORT
This report will show you summary info for each day. In a very clear way, you will see how you were doing each day of a week, so you can compare results per day. Information that you will see is the Number of Orders, Gross, Tax, Refund amounts, Tips, Service charge, NET and more…
Here is an example of a report that you would receive – download one for your market and check all available data.
CSV example (US), CSV example (EU)
REVENUE PER HOURS REPORT – ORDERS
This report will show you summary info for each hour in a day when orders have occurred. This means, that you will see the following information per each hour: Number of Orders, Gross, Tax, Refund amounts, Tips, Service Charge, NET, and more…
Here is an example of a report that you would receive – download one for your market and check all available data.
CSV example (US), CSV example (EU)
REVENUE PER HOURS REPORT – PAYMENTS
This report will show you summary info for each hour in a day when payment has occurred. This means, that you will see the following information per hour: Number of Payments, Payment Amount, Tax, Refund amounts, Tips, Amount Collected, and more…
Here is an example of a report that you would receive – download one for your market and check all available data.
CSV example (US), CSV example (EU)
REVENUE PER CREDIT CARDS REPORT
Revenue per Credit Cards report will show you summary info for all credit cards used in some period of time. You will see the following information per each card: Number of Orders, Gross, Tax, Refund amounts, Tips, Service Charge, NET and more…
Here is an example of a report that you would receive – download one for your market and check all available data.
CSV example (US), CSV example (EU)
REVENUE PER CATEGORIES REPORT
This report will show you summary info for all your defined categories as you have defined them in your Clover. You will see the following information per each category: Number of Items sold, Item price, Modifiers, Gross, Tax, Service Charge, NET and more…
Here is an example of a report that you would receive – download one for your market and check all available data.
CSV example (US), CSV example (EU)
REVENUE PER LABELS REPORT
This report will show you summary info for all labels as they are defined in your Clover. You will see the following information per each label: Number of Items sold, Item price, Modifiers, Gross, Tax, Service Charge, NET and more…
Here is an example of a report that you would receive – download one for your market and check all available data.
CSV example (US), CSV example (EU)
REVENUE PER ITEMS REPORT
Items report will show you summary info for all of your items. You will see the following information per each item: Number of Items sold, Item price, Modifiers, Gross, Tax, Service Charge, NET and some more…
Here is an example of a report that you would receive – download one for your market and check all available data.
Comparison reports
In the next sections, you can read more about available predefined comparison reports. Each of them you can prepare to receive via email, in all available frequency or time receiving. We prepared reports, you define report time and frequency of receiving each of them.
There are two groups of predefined comparison reports.
I) Payment based reports
- Payment Comparison Day vs Day
- Payment Comparison Year-To-Date
- Payment Comparison Month-To-Date
- Payment Comparison Week-To-Date
II) Order based reports
- Order Comparison Day vs Day
- Order Comparison Month-To-Date
- Order Comparison Week-To-Date
When you receive reports to your e-mail, they will be in either Excel or CSV. If you choose to receive CSV format, depending on a market you are coming from, you will have defined decimal separator either dot (.) for the US market or comma (,) for the EU market.
In the following sections, each of the reports will be explained with more detailed information.
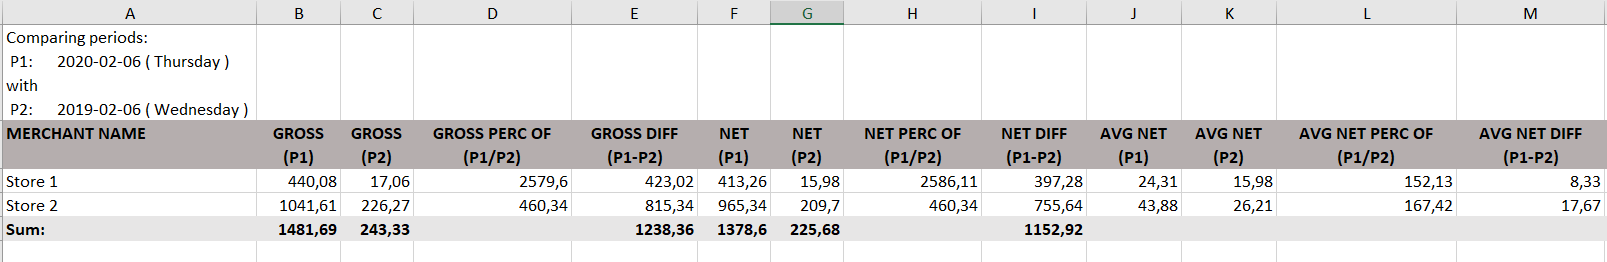
Payment Comparison Day vs Day
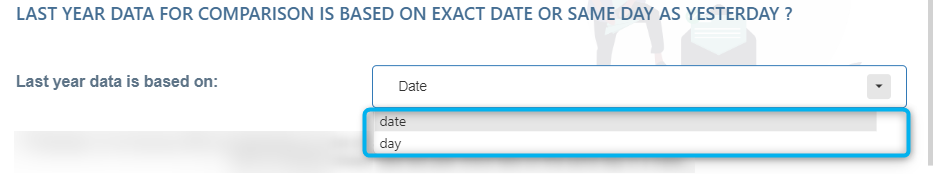
This report will compare payments received on selected Day (yesterday/today) vs same day last year. There are also two options to choose to what you will compare
- it will be the same date (example: compare 1st Jan 2021 with 1st Jan 2019)
- or closest day (example: Monday vs Monday ) in the same week
The definition of a comparing date/day is done in the 3rd step of an automatic emailing wizard.
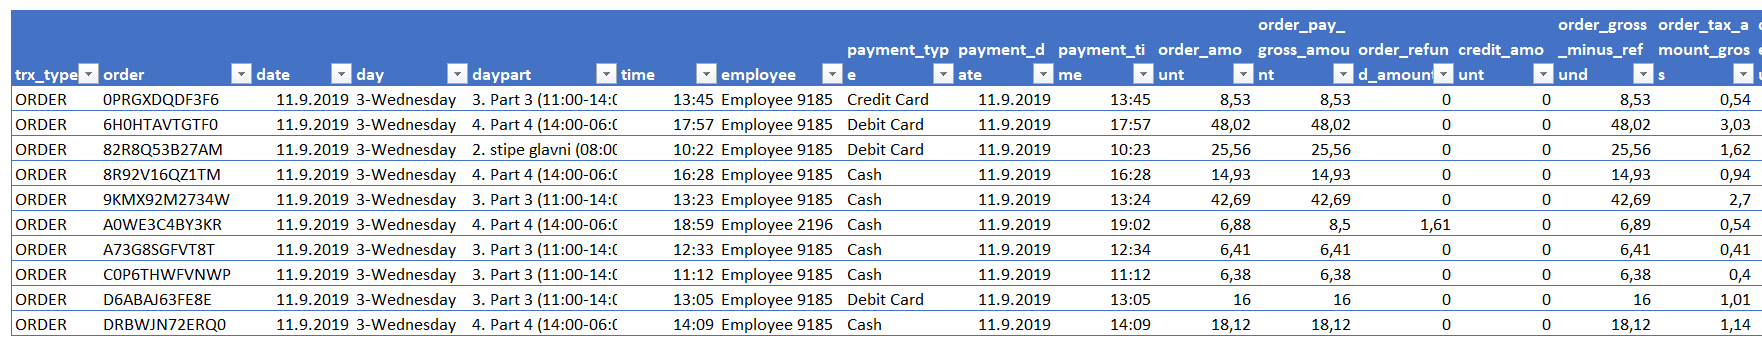
This report is prepared with predefined detailed payment information. The first period (yesterday/today) is marked as P1, while the period from last year is marked with P2. For each location and for each date you are making this report, you will get the information like gross payments for each period, the difference in gross payments (P1-P2), net per for each period and difference in net payment, number of payment per period, etc.
Here is an example of a report that you would receive – download it and check all available data.
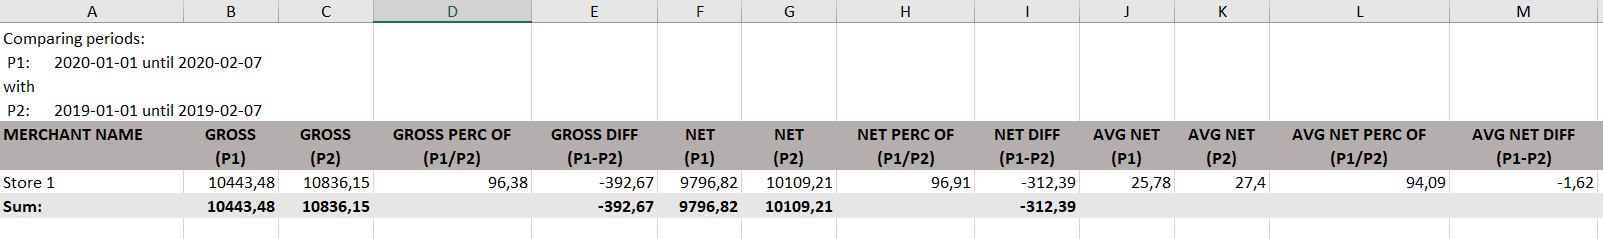
Payment Comparison Year-To-Date
In this report, you can compare payments received this Year-To-Date with the same period last year. This means that you don’t need to define data period since every day you will receive a report that will have data up to that day.
This report is prepared with predefined detailed payment information. The first Year-To-Date period is marked as P1, while the period from last year is marked with P2. For each location and for each date you are making this report, you will get the information like gross payments for each period, the difference in gross payments (P1-P2), net per for each period and difference in net payment, number of payment per period, etc.
Here is an example of a report that you would receive – download it and check all available data.
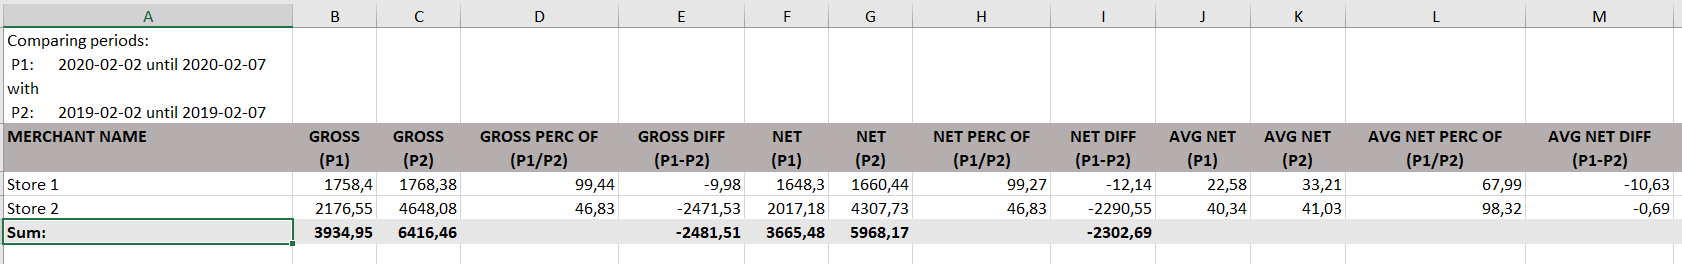
Payment Comparison Month-To-Date
In this report, you can compare payments received this Month-To-Date with the same period last year. This means that you don’t need to define data period since every day you will receive a report that will have data by definition of this report.
This report is prepared with predefined detailed payment information. The first Month-To-Date period is marked as P1, while the period from last year is marked with P2. For each location and for each date you are making this report, you will get the information like gross payments for each period, the difference in gross payments (P1-P2), net per for each period and difference in net payment, number of payment per period, etc.
Here is an example of a report that you would receive – download it and check all available data.
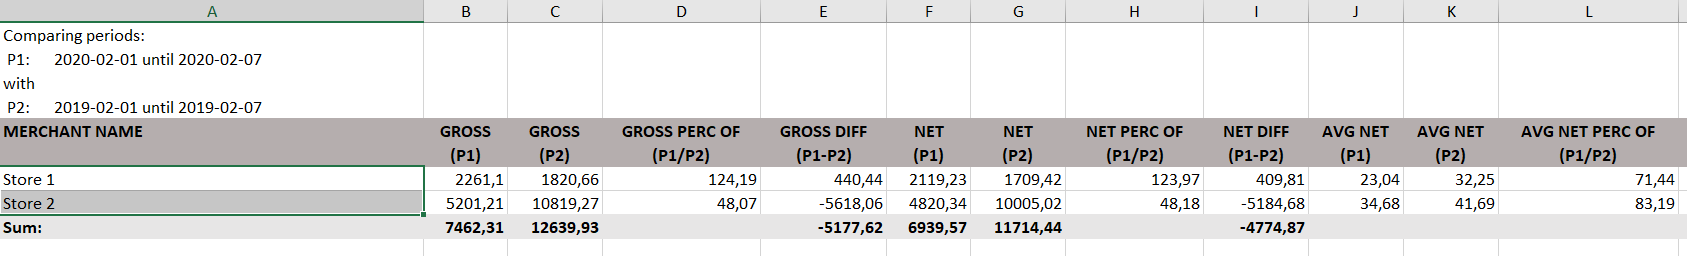
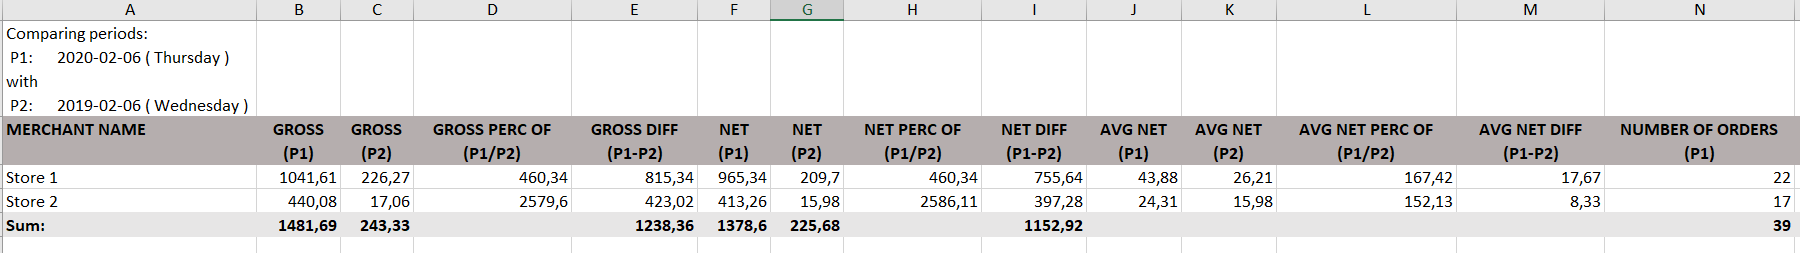
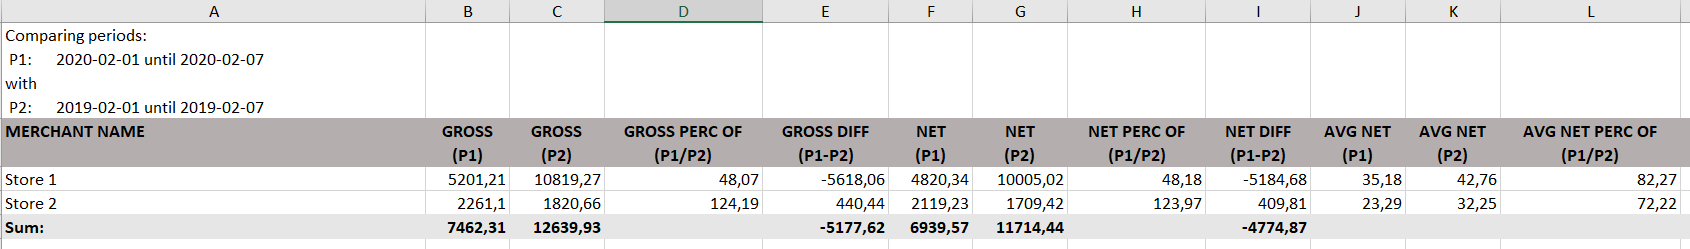
Payment Comparison Week-To-Date
In this report, you can compare payments received this Week-To-Date with the same period last year. This means that you don’t need to define data period since every day you will receive a report that will have data by definition of this report.
This report is prepared with predefined detailed payment information. The first Week-To-Date period is marked as P1, while the period from last year is marked with P2. For each location and for each date you are making this report, you will get the information like gross payments for each period, the difference in gross payments (P1-P2), net per for each period and difference in net payment, number of payment per period, etc.
Here is an example of a report that you would receive – download it and check all available data.
Order Comparison Day vs Day
This report will compare orders received on selected Day (yesterday/today) vs same day last year. There are two options to choose what you will compare:
- will it be the same date (example: compare 1st Jan 2021 with 1st Jan 2019)
- or closest day (example: Monday vs Monday ) in the same week
The definition of a comparing date/day is done in the 3rd step of an automatic emailing wizard.
This report is prepared with predefined detailed about received orders. The first period (yesterday/today) is marked as P1, while the period from last year is marked with P2. For each location and for each date you are making this report, you will get the information like gross amount for each period, the difference in gross amount (P1-P2), net for each period and difference in net amount, number of orders per period, etc.
Here is an example of a report that you would receive – download it and check all available data.
Order Comparison Month-To-Date
In this report, you can compare orders created this Month-To-Date period with the same period last year. This means that you don’t need to define data period since every day you will receive a report that will have data by definition of this report.
This report is prepared with predefined detailed orders information. The first Month-To-Date period is marked as P1, while the period from last year is marked with P2. For each location and for each date you are making this report, you will get the information like gross payments for each period, the difference in gross amount (P1-P2), net for each period and difference in net amount, number of orders per period, etc.
Here is an example of a report that you would receive – download it and check all available data.
Order Comparison Week-To-Date
In this report, you can compare orders created this Week-To-Date with the same period last year. This means that you don’t need to define data period since every day you will receive a report that will have data by definition of this report.
This report is prepared with predefined detailed orders information. The first Week-To-Date period is marked as P1, while the period from last year is marked with P2. For each location and for each date you are making this report, you will get the information like gross payments for each period, the difference in gross amount (P1-P2), net for each period and difference in net amount, number of orders per period, etc.
Here is an example of a report that you would receive – download it and check all available data.
Predefined Stock Value reports
How often you need information like how much all your stock inventory is worth, or how much different categories on the stock you have in a moment? If you need that information regularly, here are some reports that you can prepare and receive as often to your email(s) as you like.
Stock Value Reports are reports that in a simple and clear way give information on your stock in a particular moment. All stock reports will give you data only at a particular moment in time. That means that data you will see in the report are like you have it in your Clover at the very moment report was created.
The stock report that are available in this section are listed below. Just select one you would like to receive to your email(s) by clicking on its name, as shown in the picture below:
Stock value reports facts:
- Stock-based reports
- Very fast report
- Less detailed reports
In the next sections, you can read more about available predefined Stock Value reports. Each of them you can prepare to receive via email, in all available frequency or time receiving. We prepared reports, you define report time and frequency of receiving each of them.
Each report you can receive in Excel or in CSV (comma separated value) format. If you choose to receive in CSV, depending on a market you are coming from, you will receive a file in defined decimal separator either a dot (.) for the US market or comma (,) for the EU market.
Stock value reports from which you can choose from are:
- Stock By Category
- Stock By Labels
- Stock By Item SKU
- Stock By Item Code
STOCK VALUE BY CATEGORY REPORT
Stock value by category report will give you information on how many items per each category you have in the moment of report receiving. Data you will have in this repots are item category, item name, price, cost, stock count and more. If you will prepare one report for all your locations, in one report you will see listed all locations together with all needed data.
Here is an example of a report that you would receive – download one for your market and check all available data.
CSV example (US), CSV example (EU)
STOCK VALUE BY LABELS REPORT
Stock value by labels report will give you information on how many items per each label you have in the moment of report receiving. In case you have more than one label defined per item, here you will see only the first label defined on an item. Data you will have in this repots are labels defined in Clover, item name, price, cost, stock count and more…
Here is an example of a report that you would receive – download one for your market and check all available data.
CSV example (US), CSV example (EU)
STOCK VALUE BY ITEM SKU REPORT
Stock value by item SKU report will give you information on how many items per each SKU you have in the moment of report receiving. Data you will have in this repots are SKU, item name, price, cost, stock count and more…
Here is an example of a report that you would receive – download one for your market and check all available data.
CSV example (US), CSV example (EU)
STOCK VALUE BY ITEM CODE REPORT
Stock value by item code report will give you information on how many items per each item code you have in the moment of report receiving. Data you will have in this repots are item code, item name, price, cost, stock count and more…
Here is an example of a report that you would receive – download one for your market and check all available data.
Predefined detailed reports
In the next sections, you can read more about available predefined Detailed reports. Each of them you can prepare to receive via email, in all available frequency or time receiving. We prepared reports, you define report time and frequency of receiving each of them.
Report facts:
- Reports are based on Orders
- Provides more details
- Very detailed reports
Each report you can receive in Excel or in CSV (comma separated value) format. If you choose to receive in CSV, depending on a market you are coming from, you will receive a file in defined decimal separator either a dot (.) for the US market or comma (,) for the EU market.
Predefined detailed reports are:
- Order Level Details report
- Item Level Details report
- Max Orders report
- Max Payments report
- Max Order/Items report
In the following sections, each of the reports will be explained with more detailed information.
Order Level Details report
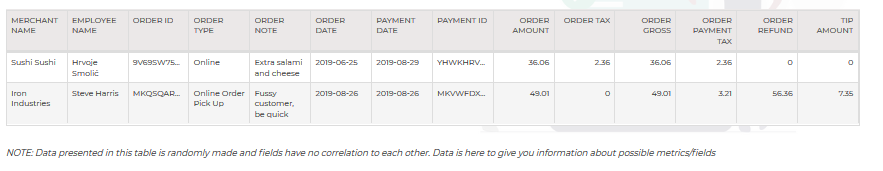
Order Level Details report is prepared with predefined detailed order information. It means that in one report you can get many pieces of information that are relevant and connected to each order. For each order, you will see the information’s like merchant name, order type, device name, order number, order date, day, hour, time, employee, payment type, payment date, payment time, card type, order amount, order gross, NET, refunds and many more. If your report is prepared for more locations, in one table you will see all the locations with all this information.
Here is an example of a report that you would receive – download one for your market and check all available data.
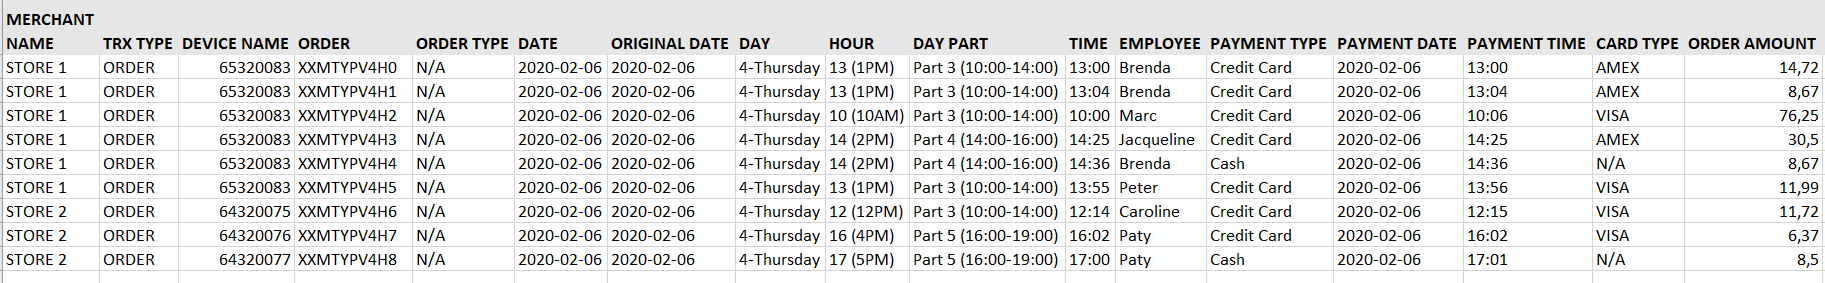
CSV example (US) , CSV example (EU)
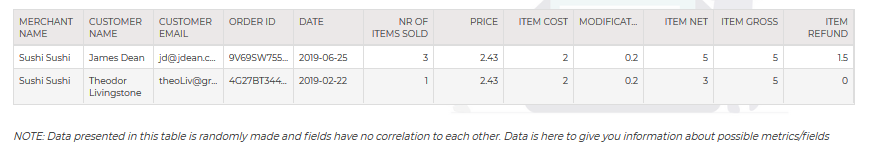
After receiving a report to mail and formatting it as a table, the data you get would look like on a picture. How to prepare CSV as an Excel file you can read here.
Item Level Details report
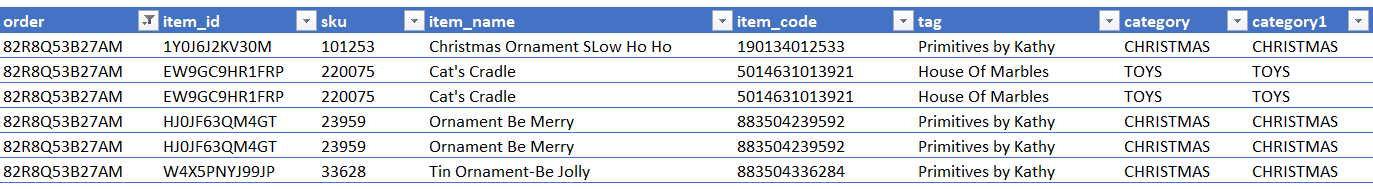
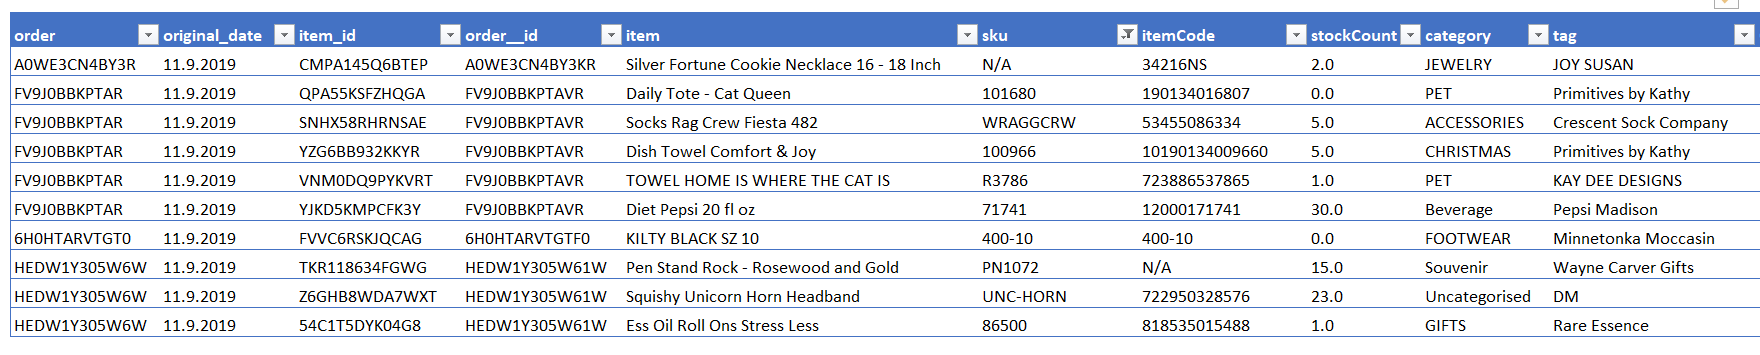
Item Level Details report is prepared with predefined detailed items and order information. It means that in one report you can get many pieces of information that are relevant and connected to each order. For each order, except basic information like merchant name, order type, device name, order number, order date, day, hour, time, employee, payment type, payment date, payment time, card type, order amount, order gross, NET, refunds you will also see much information on items like item code, item SKU, item name, labels, categories and more…
Here is an example of a report that you would receive – download one for your market and check all available data.
After receiving a report to mail and formatting it as a table, the data you get would look like on a picture. How to prepare CSV as an Excel file you can read here.
Max Orders report
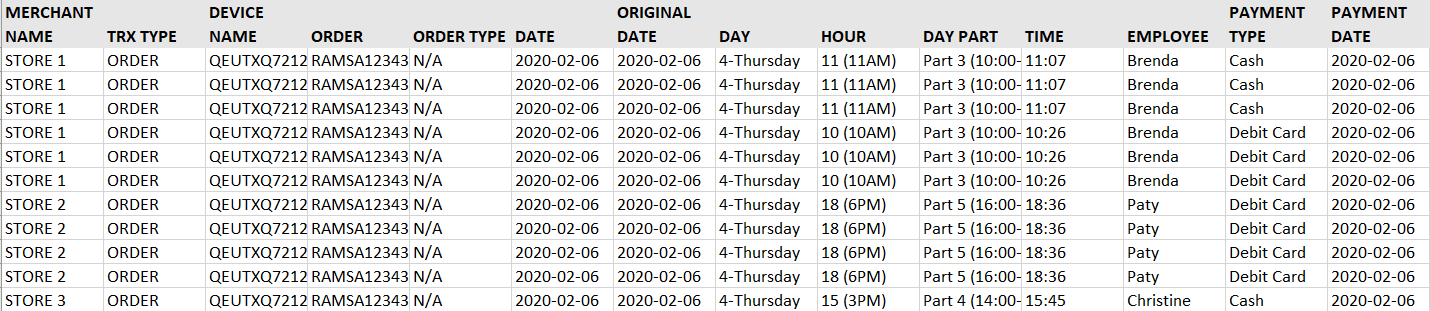
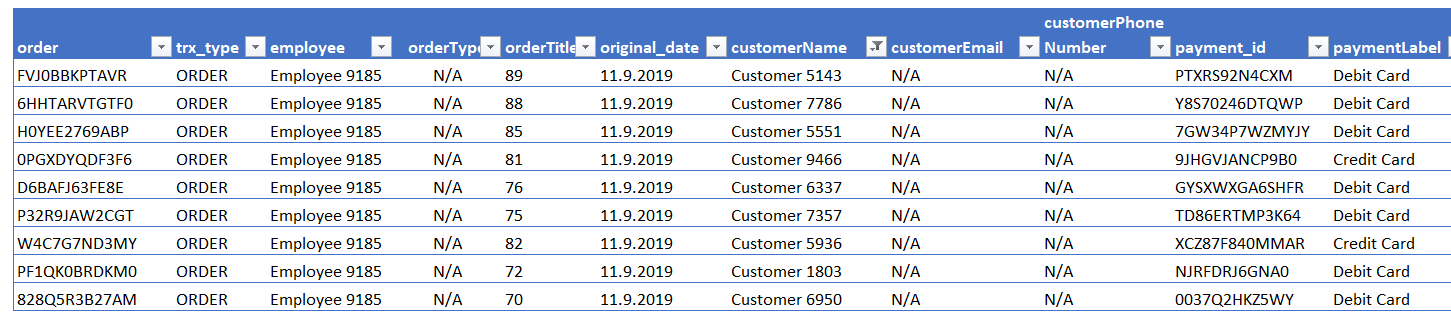
Max Orders report is prepared with predefined detailed order information. It means that in one report you can get many pieces of information that are relevant and connected to each order. For each order, except basic information like merchant name, order type, device name, order number, order date, day, hour, time, employee, payment type, payment date, payment time, card type, order amount, order gross, NET, refunds you will also see some pieces of information about your customers like customer name, email or phone number. This data you can have in case you are saving it in your Clover.
Here is an example of a report that you would receive – download one for your market and check all available data.
After receiving a report to mail and formatting it as a table, the data you get would look like on a picture. How to prepare CSV as an Excel file you can read here.
Max Payments report
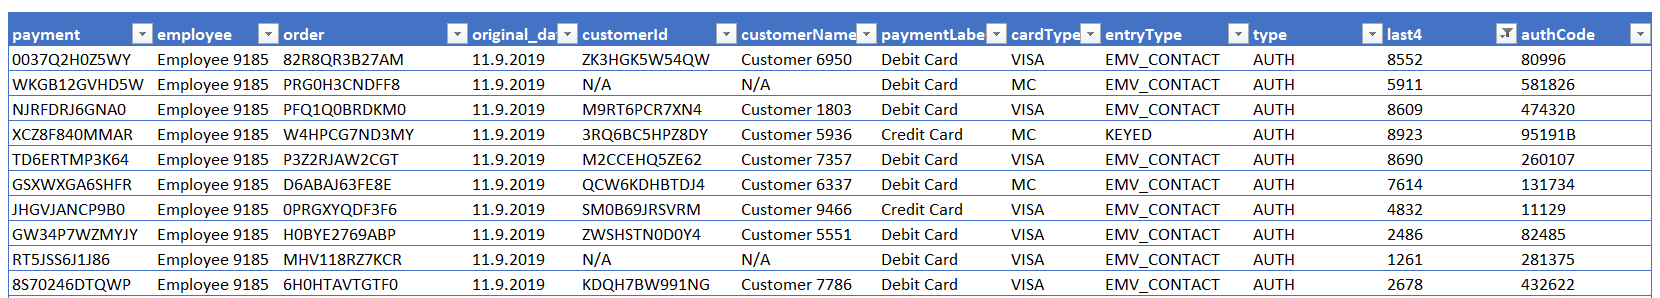
Max Payments report will show you all the information you can get on Payments. Here you will get information like: order number, order day, date, time of payment, customer, employee, NET, gross but as well details on payment like last 4 of cc, auth code and many more…
Here is an example of a report that you would receive – download one for your market and check all available data.
After receiving a report to mail and formatting it as a table, the data you get would look like on a picture. How to prepare CSV as an Excel file you can read here.
Max Orders/Items
Max orders/items report is type of report that combines data from several other reports. Because of that in one view you can get data on orders, items, customers, and payments. This is a most detailed report with information like merchant name, order number, order type, date, day-part, day, employee, devices, payment type, payment date, card type, order amount, order gross, NET, refunds, customers data but many others as well.
Here is an example of a report that you would receive – download one for your market and check all available data.
After receiving a report to mail and formatting it as a table, the data you get would look like on a picture. How to prepare CSV as an Excel file you can read here.
Custom Reports
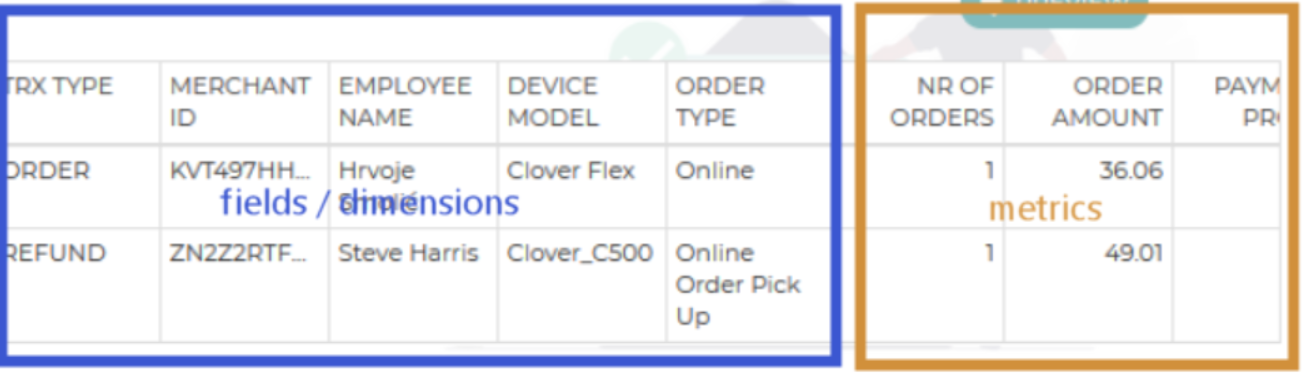
Custom reports are based on a pivot table. Using a pivot table to create a report, allows users to create your own reports with data as needed. Data are grouped into two main groups: metrics fields and dimension fields.
- metrics fields – metrics are numbers and they are measurable. They can be counted (a total or a sum), made as an average, or a ratio (one number divided by another number).
- dimensions fields – dimension is an attribute (text data), example name of location, device, order number, etc. Dimensions can not be counted, made as an average or ratio.
The tables in reports organize dimension values into rows and metrics into columns. For example, this table shows dimensions (Trx type, MerchantID, Employee name, Device model and Order type) and three metrics (Number of orders, Order amount and Payment label).
Custom Order Level
CUSTOM ORDER LEVEL REPORT
Custom Order Level report, is based on order level data. Since it is made in pivot table, you will be able to select columns that can be found on orders created in the selected time period.
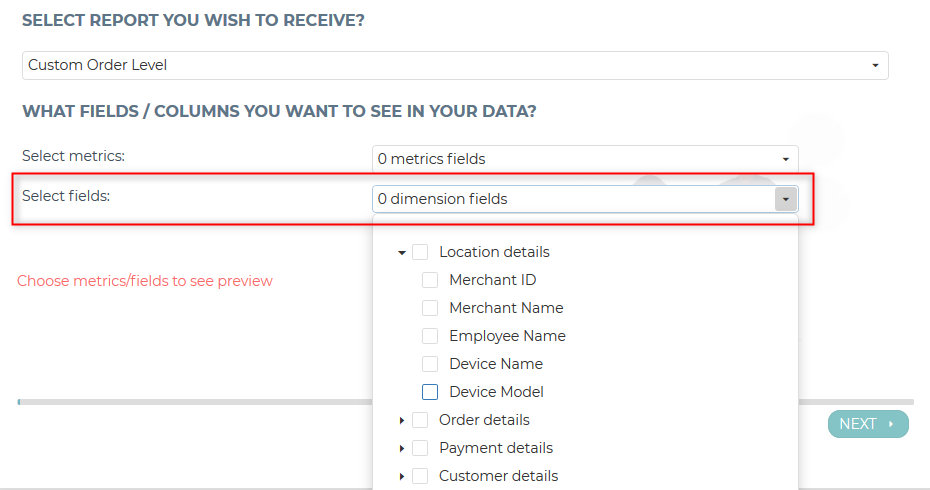
When you start creating a new Custom Order Level report, there will be no information about the report or list of data that you will see in the report. To get an example you have to start creating your own report what means you need to define exactly which data you want to get.
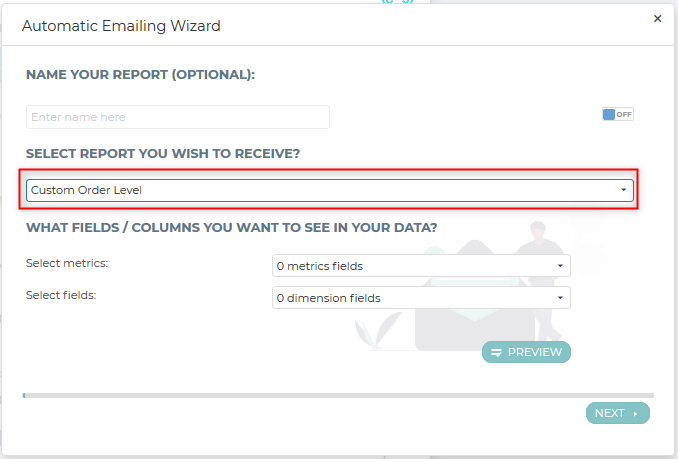
Clicking on icon “Preview” you will see a table with data as you selected them. If you have not selected any data yet, there will be a message “Choose metrics/fields to see preview”.
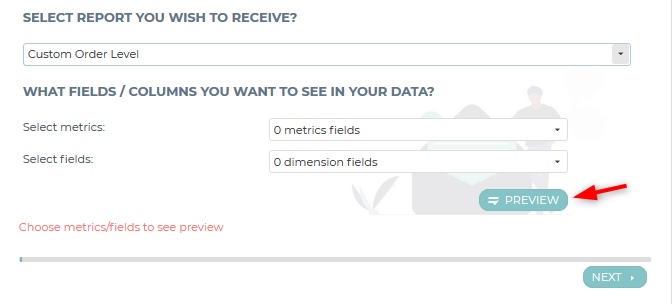
You can start preparing your report, either by choosing metrics or by dimension fields. At any time you can add a new field or remove one you added earlier. If you already clicked on icon “preview”, at the moment you add a field, you will see change in the preview table. In the next couple of pictures, you can see the process of creating one Custom Order Level report.
Step 1 – After clicking on-field “Select metrics“, you will see all available metrics
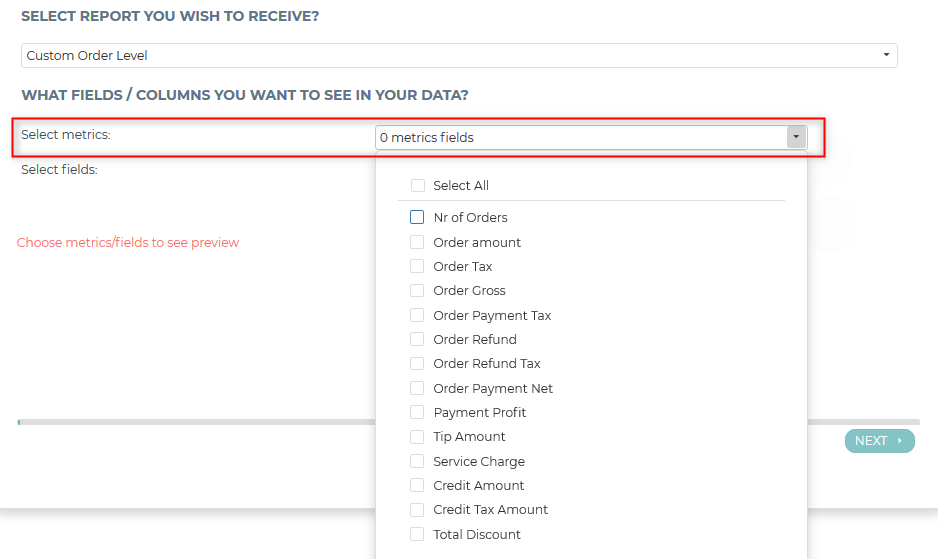
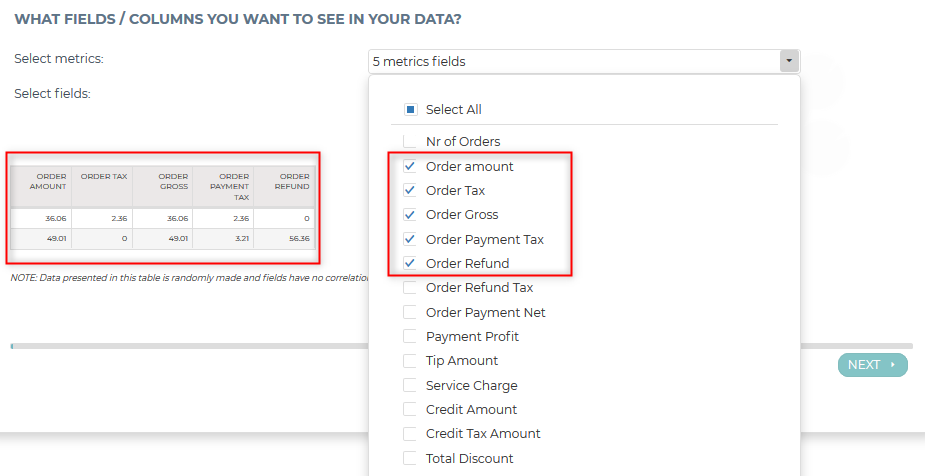
Step 2 – Mark metrics you want to have in a report. As soon as you click on a field, you will see it in a preview table.
Step 3 – After clicking on-field “Select dimension fields“, you will see all available dimensions. Dimensions are divided into 4 groups, like Location details, Order details, Payment details, and Customer details.
Step 4- Mark the dimensions you want to have in a report. As soon as you click on a field, you will see it in a preview table. If you decide not to use some field, just unclick the field.
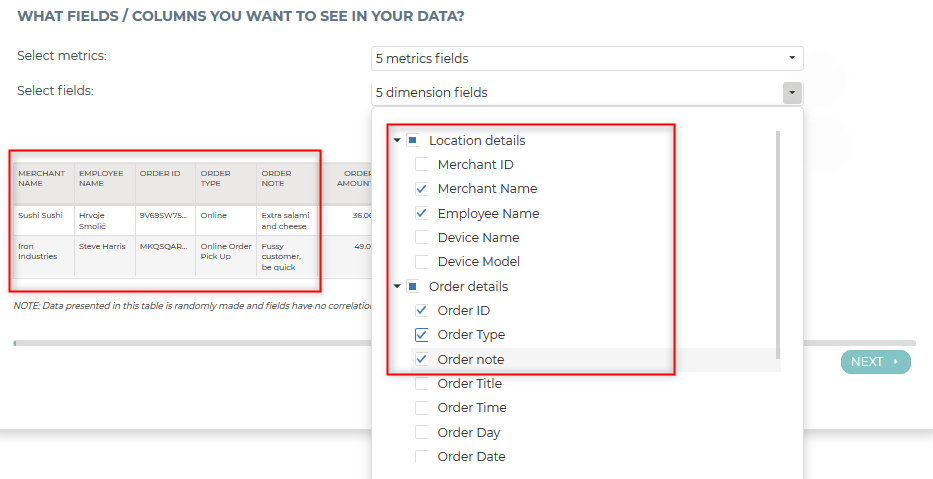
Step 5- When you finished with adding all metrics and dimension fields, you can see an example. Please note here you will not see your data, those are demo data.
To finish creating this report, just follow the Automatic Emailing Wizard. It is the same for all reports you are creating.
Custom Item Level
CUSTOM ITEM LEVEL REPORT
Custom Item Level report, is based on item level data. Like, Custom Order Level report, it is based on a pivot table. Due to pivot table possibilities, you will be able to select columns that are connected to items from orders created in the selected time period.
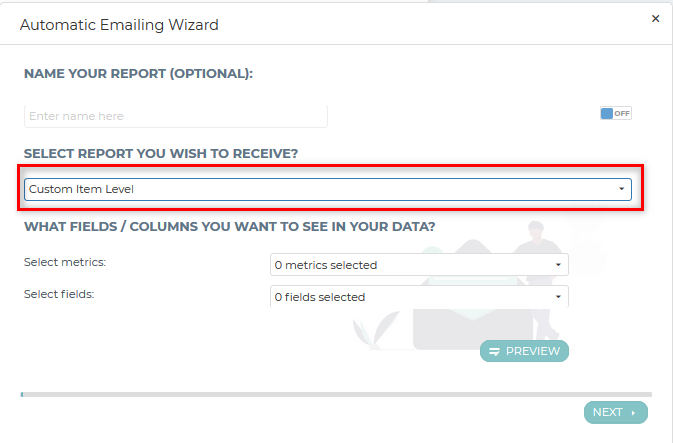
Clicking on icon “Preview” you will see a table with data as you selected them. If you have not selected any data yet, there will be a message “Choose metrics/fields to see preview”.
You can start preparing your report, either by choosing metrics or by dimension fields. At any time you can add a new field or remove one you added earlier. If you already clicked on icon “preview”, at the moment you add a field, you will see change in the preview table. In the next couple of pictures, you can see the process of creating one Custom Order Level report.
Step 1 – After clicking on-field “Select metrics“, you will see all available metrics fields
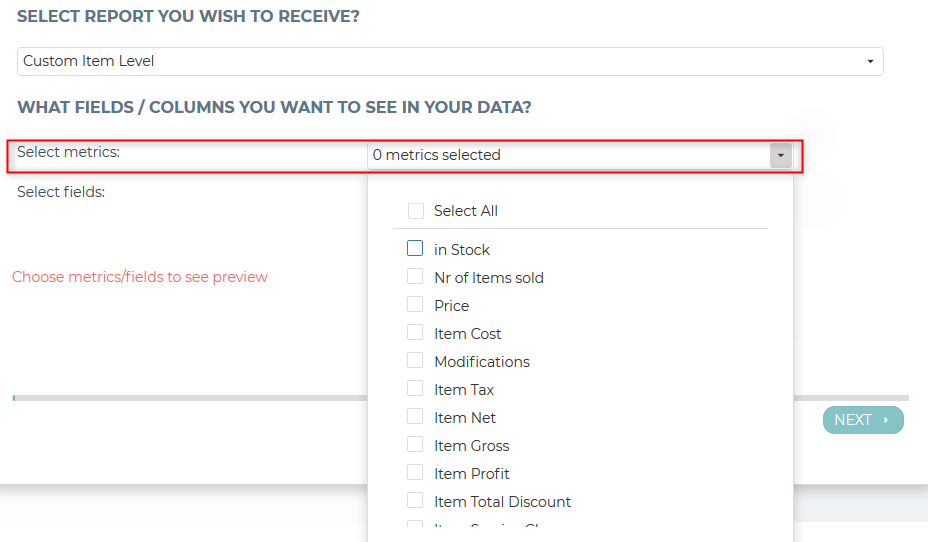
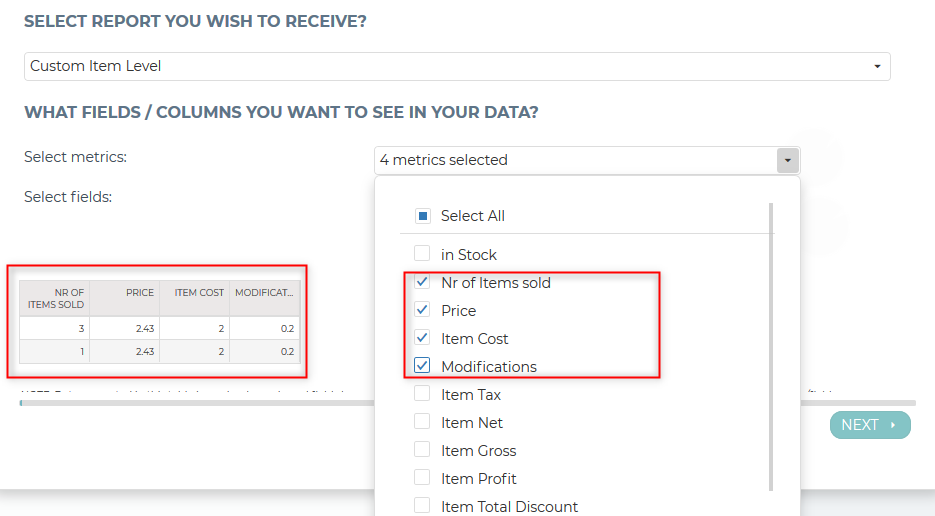
Step 2 – Mark metrics you want to have in a report. As soon as you click on a field, you will see it in a preview table.
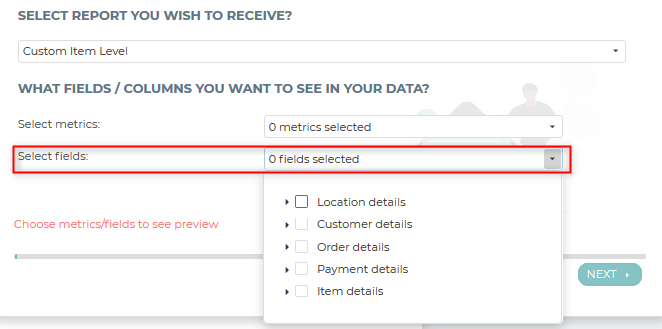
Step 3 – After clicking on-field “Select dimension fields“, you will see all available dimensions. Dimensions are divided into 5 groups, like Location details, Customer Order details, Payment details, and Item details.
Step 4- Mark the dimensions you want to have in a report. As soon as you click on a field, you will see it in a preview table. If you decide not to use some field, just unclick the field.
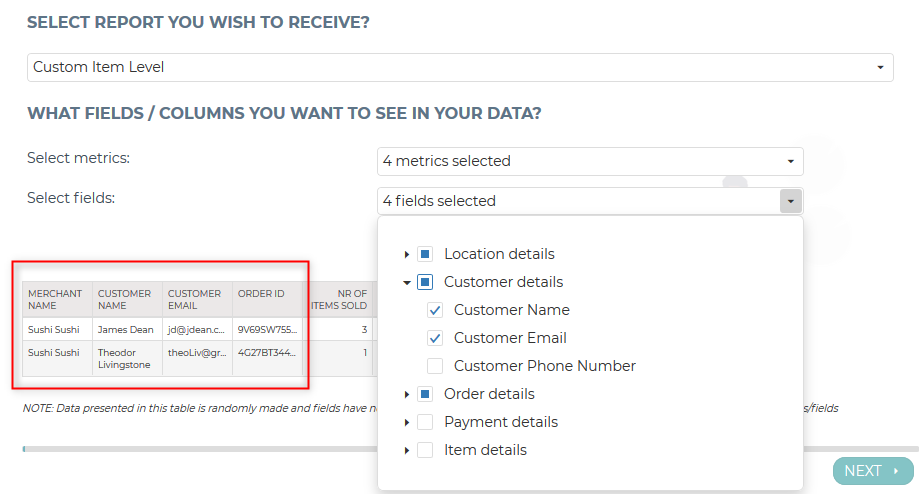
Step 5- When you finished with adding all metrics and dimension fields, you can see an example. Please note here you will not see your data, those are demo data.
To finish creating this report, just follow the Automatic Emailing Wizard. It is the same for all reports you are creating.
Frequently Asked Questions / Troubleshooting
In the next sections, we will gather frequently asked questions we received at our support email address.
If those questions/answers haven’t solved to your problem, please send us an email with your question to clover@qualia.hr
Converting CSV into Excel
Comma-separated values (CSV) is a widely used file format that stores tabular data (numbers and text) as plain text. Each field of text in the file was traditionally separated by a comma (,), however, currently, CSV files can resemble any spreadsheet. The only differences are that the file extension is .csv, it can only have a single sheet in a file and it cannot save cell, column, row styling or formulas.
When you receive a file from the Reports2Mail app it will be in CSV format. Depending on which software you are using, there should be an IMPORT file option where you choose the type of file you are importing (CSV).
Newer versions of Microsoft Excel (2019) open this format on its own.
On Microsoft Excel version 2016 you will have to ‘import’ this file through several steps
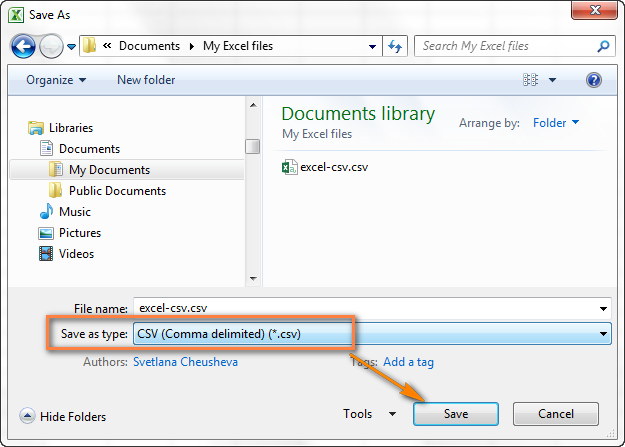
1. Saving file – save a csv file you received via email to the location to the device you are using.
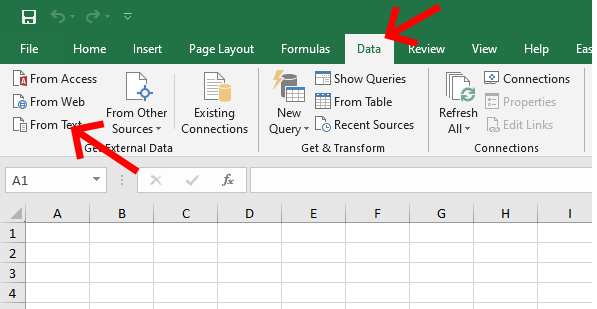
2 – Open Excel and click on DATA- FROM TEXT ( locate file you have received)
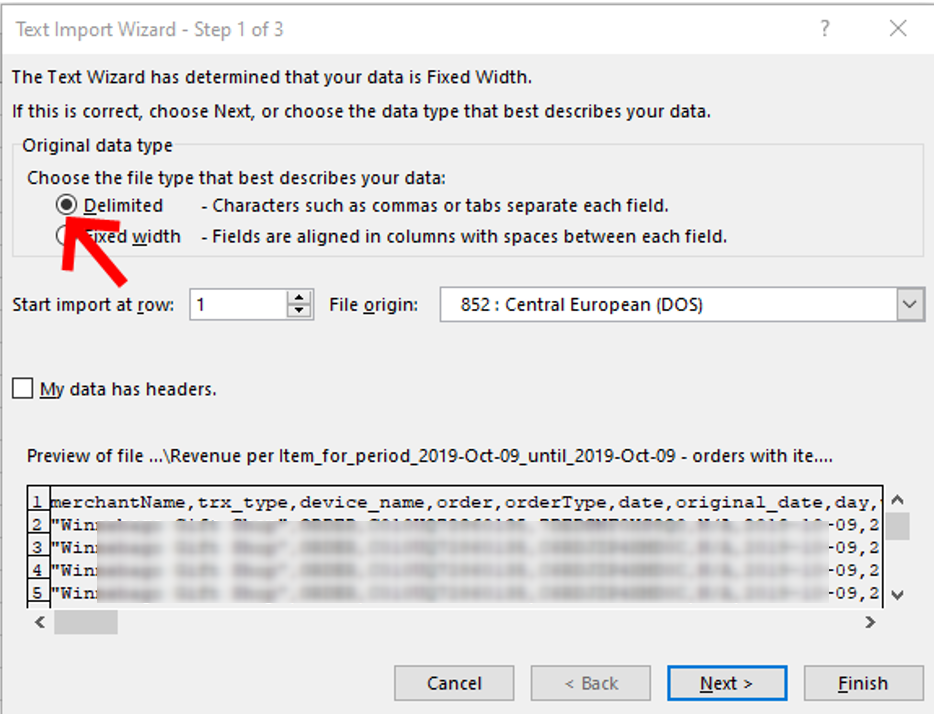
To finish import from csv to excel, follow the three-step wizard:
STEP1: Select delimited and press next
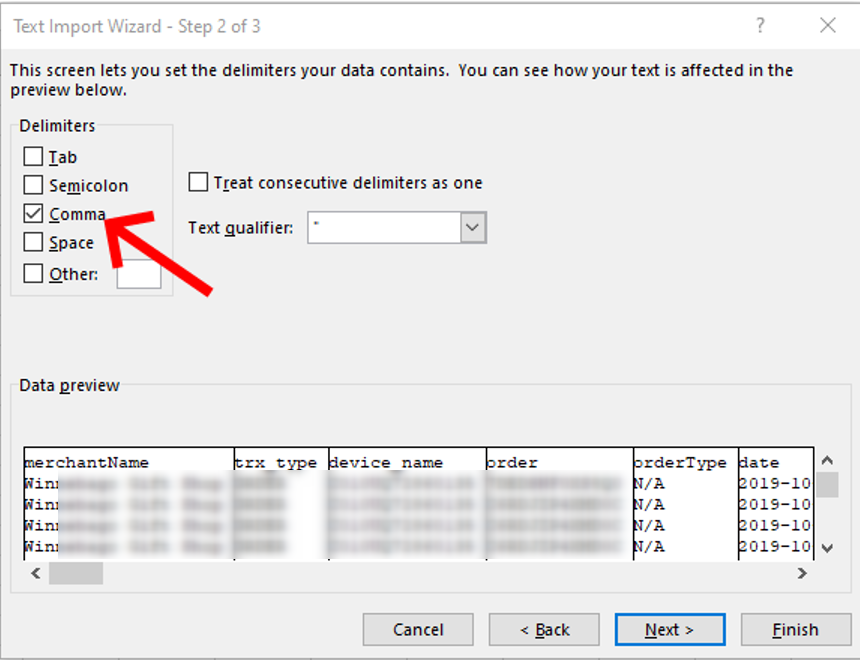
STEP2: select ‘comma’ and press next
STEP3: choose decimal separator for numbers:
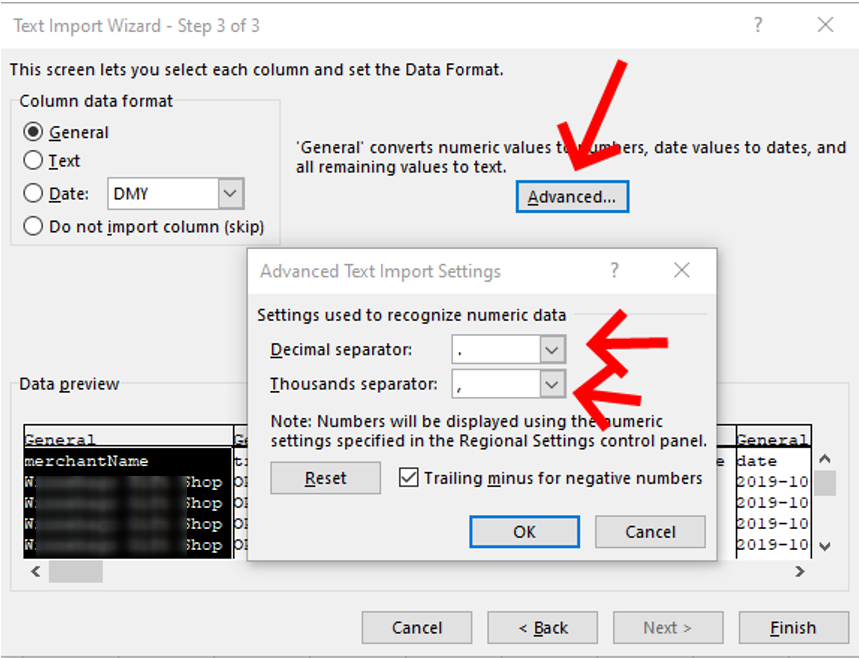
Depending on your local computer settings, decimal separator is usually dot(.), and thousand separator is comma(,)
We hope we managed to help you with this description.
How to set up custom data period?
I want to create a report with a special date range, is that possible?
Yes, this is possible. To do that, you need to use the option “Custom data period“. This option is only available in the Basic and Advanced tier. In the data period, you define the period for data retrieving. The data period is connected to time you are receiving a report, but as well as how you defined your business day.
How to set up a Custom data period you can find in this article.
From the dropdown list in step 3 of a wizard (Time, Frequency and Data period), you can choose several predefined periods like Today, Yesterday, Last 3 days etc., and Custom data period as well. In case none of those periods are one you need, from the drop-down menu, choose the Custom data period.
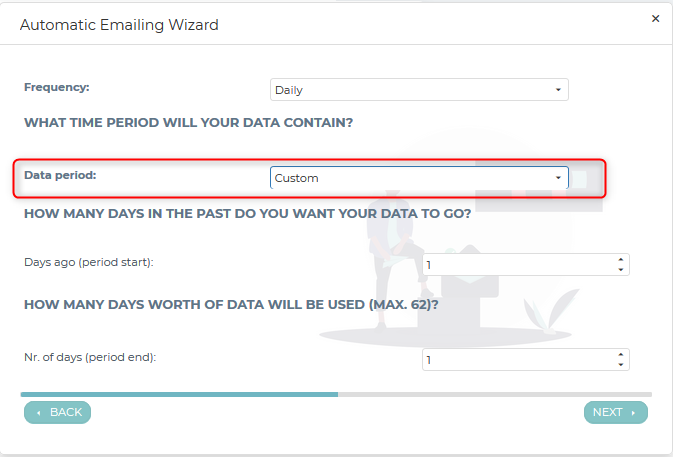
When this option is selected, new fields will be available.
- Days ago (period start)
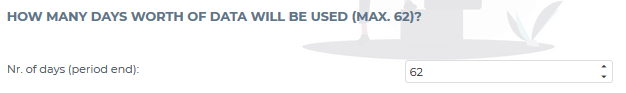
- Nr. of days (period end)
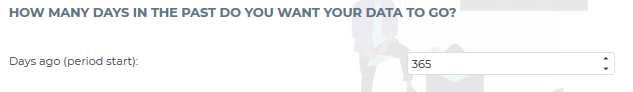
In the field “Days ago (period start)” you can put any day in the past. Days are defined by the number of days not by using the calendar. That means that you have to recalculate months and days into a number of days. For example, you can see we put 365 days. Instead of 365, you can put any number but maximum to a day you started to work in Clover.
In the second field “Nr. of days (period ends) you can define how many days you want your report to consist of. Please be aware that the maximal number of days is 62 (2 months).
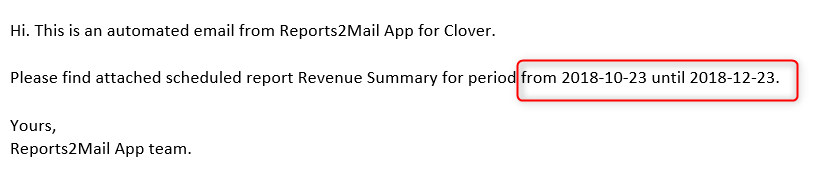
The name of the report that you will receive to your mail will consist of the period that you have defined. In our example that is from 2018-10-23 until 2018-12-23.
I have the STARTER Tier - why can't I prepare some reports?
In STARTER (free) tier, you have only the following Reports: Revenue Summary, Revenue by Order types reports (both with restriction of 1-day date range – data for today and yesterday only).
To avoid any limitations on reports, please upgrade your Starter tier into Basic or Advanced Tier. With Basic or Advanced Tier you will have the opportunity to choose from 20 predefined and up to 20 custom reports. About reports available in each tier you can read more in this article.
Multi-location support
I have more than one Merchant ID (location) in Clover. Does Reports2Mail App support that?
Yes. If you have more merchant locations, they all can be integrated into our multi-location environment.
How to set up a Multi-location feature?
- Each location you want to integrate into a multi-location environment must be BASIC or ADVANCED tier
- Log in at least once with each of your locations (initial login) to Analytics App
- Send us an e-mail at reports2mail@qualia.hr with your merchant IDs for each location
- Within 1-2 business days, we will send you an e-mail confirmation
After this is done, you are ready to prepare reports for all of your linked locations.