Dashboards – all the data you need from BusinessQ Reports
Dashboards – all the data you need from BusinessQ Reports
Dashboards – all the data you need from BusinessQ Reports
Dashboards – Create appropriate BusinessQ Dashboards and take action on what is really important; stay up-to-date with what’s going in your business.

HOW IT WORKS
From your data source to the information dashboard in minutes.
CONNECT
BusinessQ can connect to your Relational, Excel or CSV data via and easy-to-use DataSource connector. Just connect to your data and visualize it!
We are working on new database connectors for future releases. In the latest version, you can connect to:
- Microsoft SQL Server
- Oracle
- MySQL
- PostgreSQL
- Excel files
- CSV files

BUSINESS MODEL
In BusinessQ we have developed the “Business Model”.
It is a meta model of reporting data.
With it, we succeeded in achieving our basic goal – to enable ANY BusinessQ user to define and make their own report from scratch, all in a drag and drop interface, and without writing a single line of SQL code!
Once defined, a Business Model is a helpful layer between an end user and any database or data warehouse. It supports all types of complex joins between tables (inner, left, right joins) as well as different operations inside joins ( =, >, <, …).
VISUALIZE
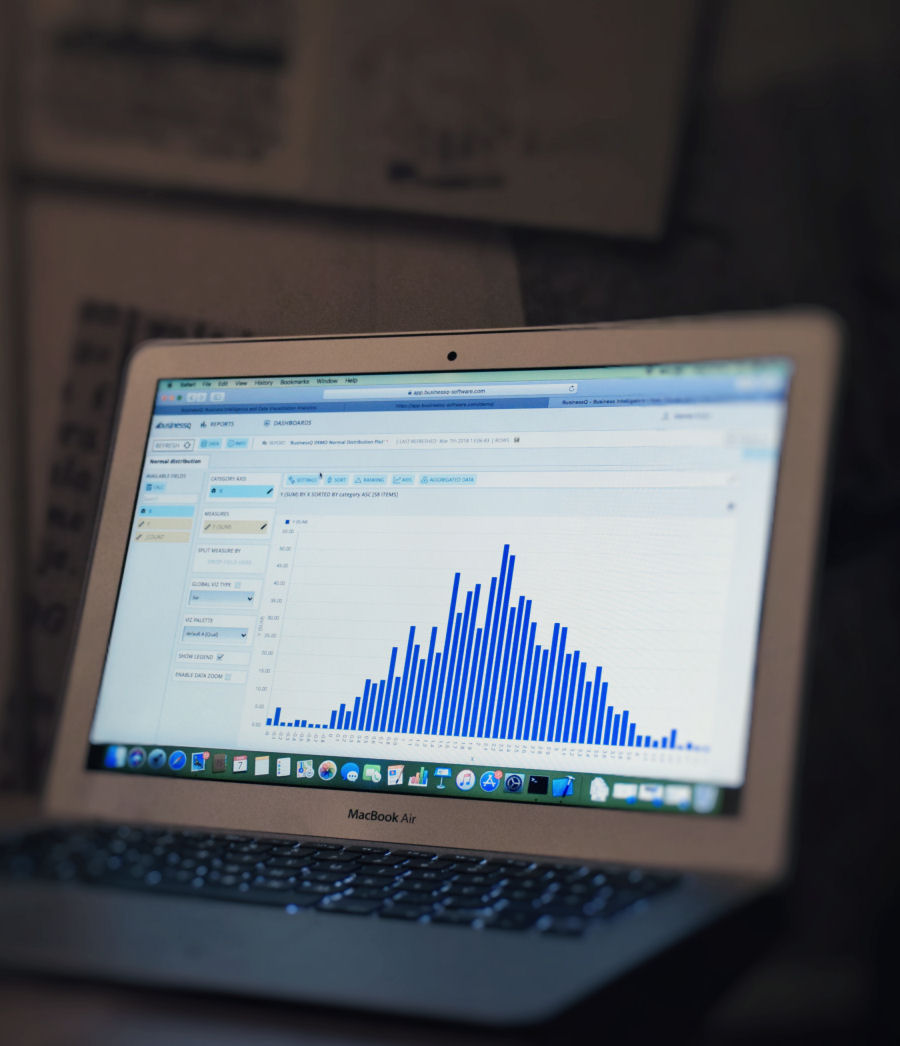
In BusinessQ, select the appropriate data visualization from our carefully selected VISUALIZE tabs.
IN MEMORY ANALYTICS
After data retrieval in a BusinessQ report, everything you do will be based on our fast in-memory routines.
You can perform:
- DATA MANIPULATION
( SQL filters, in-memory filters, automatic generation of time hierarchies) - SHOW DATA AS (absolute values, percent of total, ranking, running values)
- DATA AGGREGATION
( sum, count, average, minimum, maximum ) - ANALYTICS
(sort ASC / DESC, top / bottom N items ) - REGRESSION
(linear, polynomial, logarithm ) - FORECAST
( add new periods to chart to see trend of regression lines )
DASHBOARDS
Create appropriate BusinessQ Dashboards and take action on what is really important; stay up-to-date with what’s going on in your business.
Combine all the data you need from Reports; organize them, from multiple data sources and even multiple databases into the single Dashboard.


