Whether the type of business you are in, customers are your backbone. Without customers, no…

What is my best day of the Week?
Are you often wondering which Day of the week your average sales are the highest? Hence, if not for the Day in a week, maybe you would like to know which week of the year was your best?
No matter what industry you’re in, any sector dealing with customers needs to keep track of its sales. Using average sales across various periods can give you an excellent idea of how well your sales strategies and marketing campaigns are performing. Furthermore, which tactics connect with consumers, and how successful your sales team is at converting leads?
My Average sales
Calculating your average sales depends on the period or frequency you want to analyze and the total sales value. We usually measure average sales on a smaller scale, such as daily or weekly. A larger scale, monthly or annual, is much better for other cases because it gets data from extended periods.
Of course, you can calculate average sales by yourself. But is it necessary to waste your precious time when you have Analytics BusinessQ for that? The more extended period we want to analyze, the more we all need a system to help us.
Knowing that, let’s look at Analytics BusinessQ and how the app can help you get the data you need.
Advanced Sales Report
Until recently, Analytics BusinessQ was very limited with the time frame merchants can obtain in the reports. The maximal period was four months. But, as we all know, this is not enough; we put all our efforts together and developed a powerful new solution that can offer limitless reports.
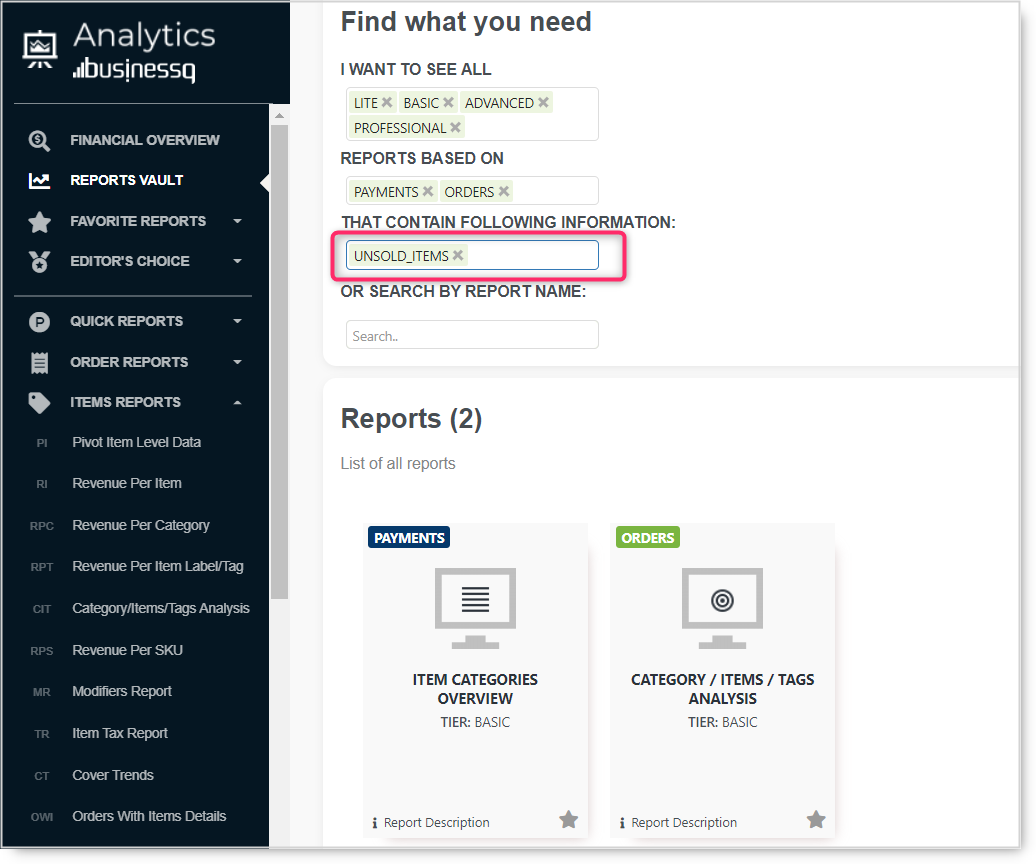
The Advanced Sales Report is one of the new reports that use this limitless period in combination with AI (Artificial Intelligence) power. Mainly, the report is part of our AI Machine powered report section and is available in the PROFESSIONAL tier of the Analytics BusinessQ app for Clover POS. To access it, expand the AI Powered reports and click on Report. For regular use, mark it as a favorite, and it will always be easy to reach.
Once you open the report, you will automatically get data for the location you are logged in. In case more sites are linked, here you will be able to get data for each of them. Just choose the one you need, and voila, you can get deep knowledge of it.
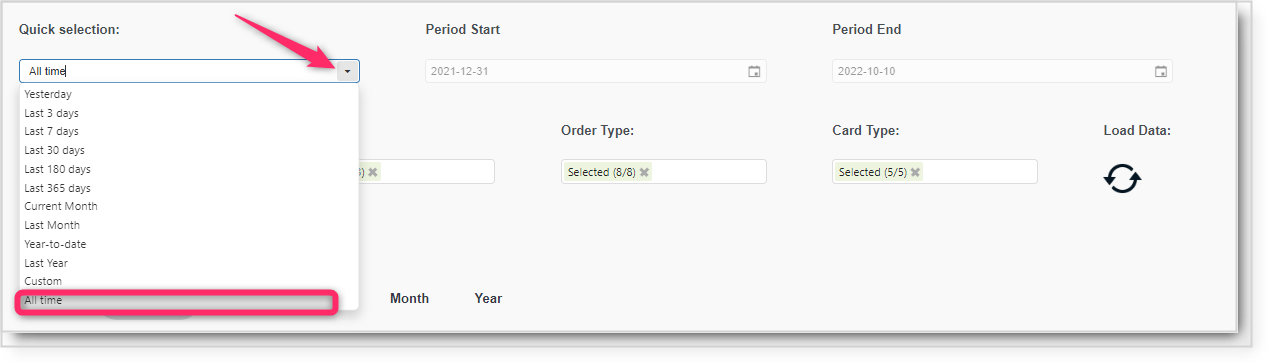
The quick selection represents the period in this report; the default value is Yesterday with “Day in a Week” as a scale. The report offers attributes such as Employees, Devices, Order Type, etc. All the values are automatically selected as the default values. Wish to check only a particular attribute? No problem at all! You can easily remove specific values by unselecting them.
Not only that, but you will find a graph that shows several metrics like Gross Sales, Discount, Refund, Net Sales, and Quantity. You can unselect metrics you don’t need and see only one you want to check out in more detail.
Whatever period or metrics you select, Analytics is grouping your data. By default, it is a “Day in a week,” but you can also choose from the list of available period groups. As you change the scale, the graph changes as well, accordingly.
On which day do I sell the most?
Now you want to check which day in the week is my best day, which day I sell the most, and my gross sales are the highest.
All you have to do is open the report and choose it depending on the period you wish to analyze. In this example, we choose “All time” data to explore it from the first working day with Clover POS.
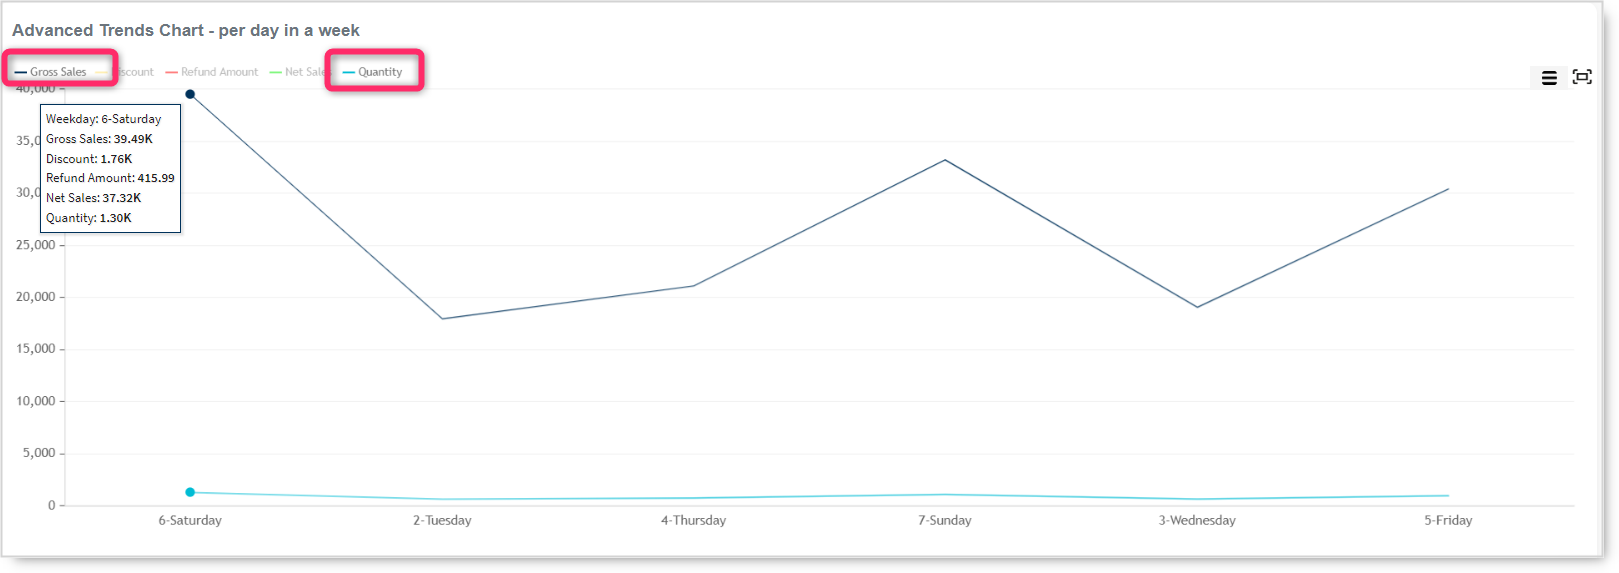
In the graph, choose the metrics you want to look deeper into. Here we select “Gross sales” and “Quantity” in this example. As financial & quantity values can vary, it is better to check economic and abundance metrics separately.
Let’s check out values if we select only “Quantity.”
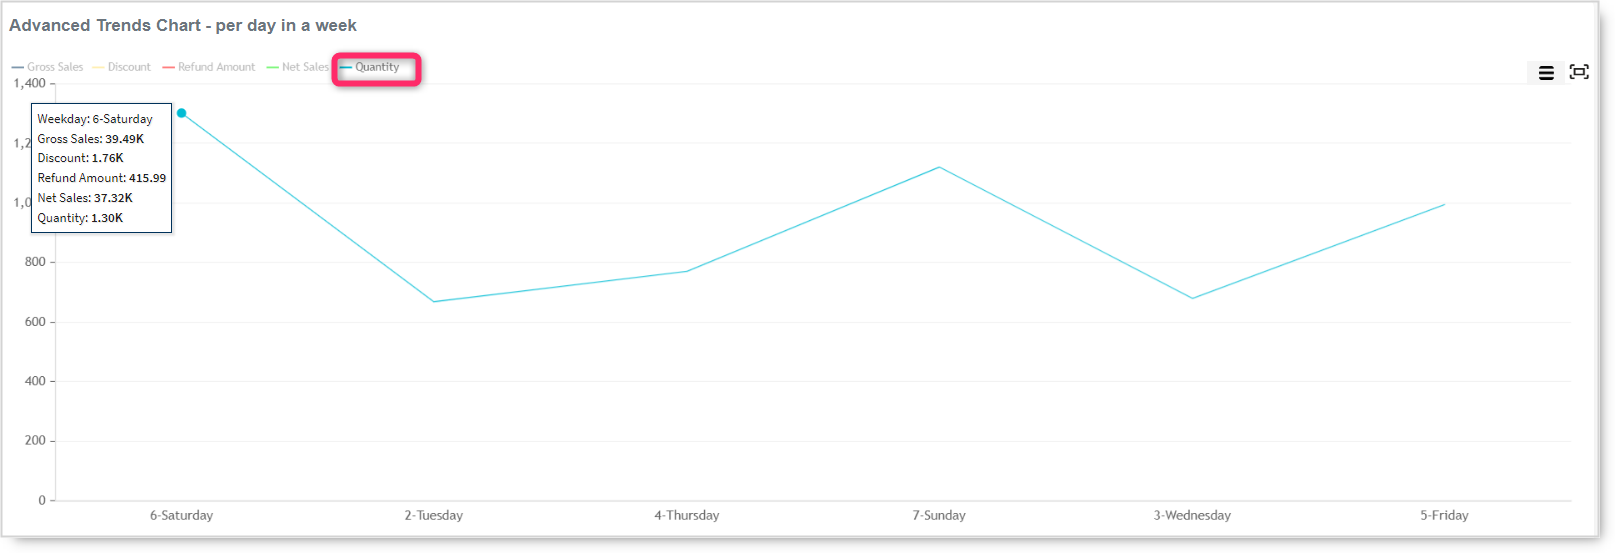
This example shows us that, however we look into the data, Saturday is the best day for our business. Based on this information, you can focus more on Saturday and make it extraordinary. Consequently, if you focus on the weakest day, you will automatically get better results.
To get more insights on your business, play with this report, check out longer or shorter periods, or group data by different periods. Gathering all the information can help you in your daily decision-making.
For example, you’ve noticed a drop in average sales for a particular day of the week: you can check what happened that Day, prepare a strategy in case such behavior occurs again, etc.
Don’t waste your valuable time any longer! Use Analytics Advanced Sales Report and get deep knowledge of your business in the past; learn from the past to grow in the future. In conclusion, use the Avances Sales report frequently to know which days are your best or words.
As always, we want to hear any suggestions you may have. After all, we are building this app for you. We hope you are as excited about the new changes as we are.
Have any new ideas or suggestions? Write to us!
Happy Analyzing!
Your Analytics | BusinessQ App Team
Qualia Data Sciences LTD
Related posts