DataViz: Conditional coloring in BusinessQ
Have you ever thought why conditional coloring is so important in visualizations?
Let me show you how we do it in BI software BusinessQ!
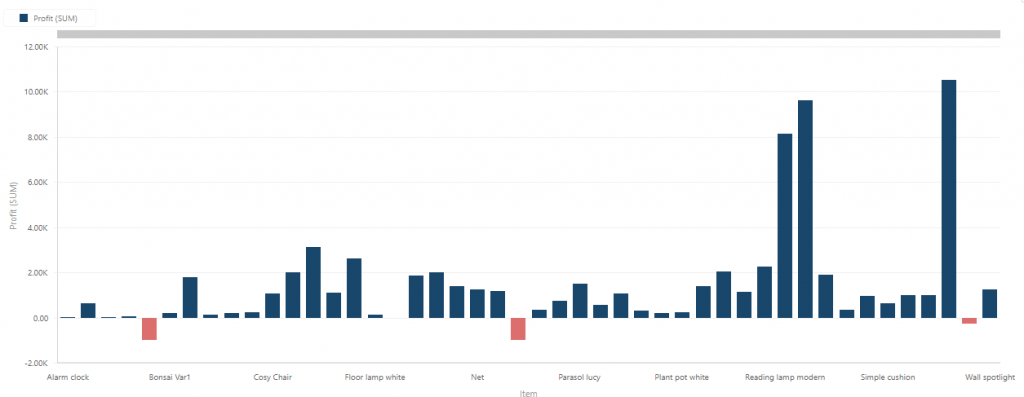
With conditional coloring users and decision makers can notice good and bad indicators in a blink of an eye.
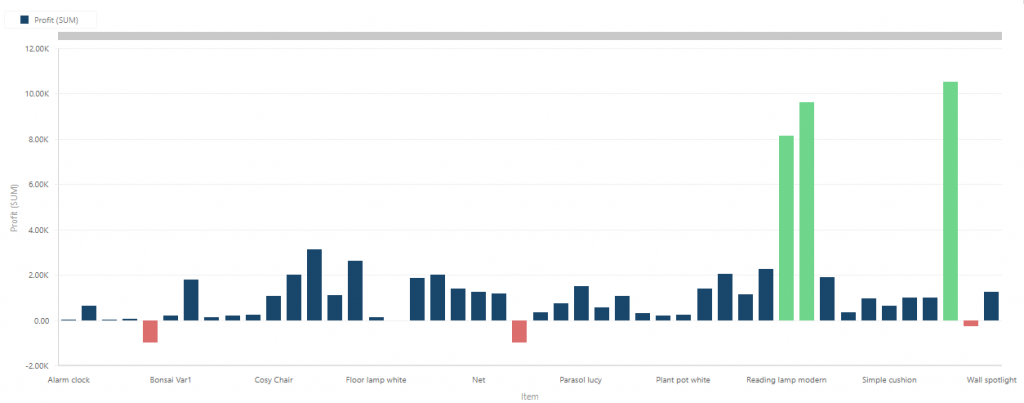
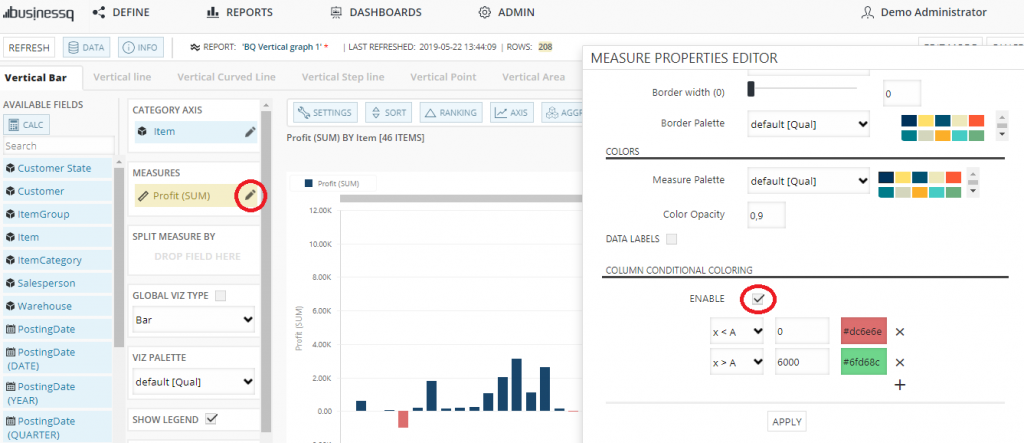
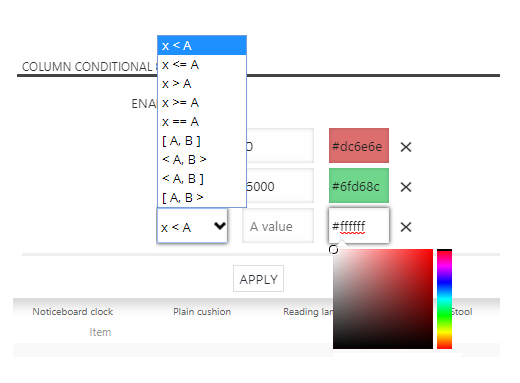
It can be adjusted to show amounts less than determined, bigger, equal or any other combination, as you wish. One more good possibility is that on the same visualization, you can use several types of conditional coloring. For example, look at the picture down below. There is adjusted to show negative profits with red color, profit bigger than 6000 is in green while others are blue:
The possibilities are limited only with your imagination, business needs and of course, your data.
We challenge you to try BusinessQ for free and share with us your impressions!
You can write to us or leave a comment!
Can’t wait to hear your thoughts!
We are developers of data visualization software BusinessQ. Try it for free and make reports and dashboards that make sense, without chart junk.
Related posts