Since the early days, people are faced with making decisions based on choices at the…
BusinessQ v17.2
We are happy to inform you that we have published new version of BusinessQ (v17.2).
Some of the most exciting news are Calculations that you can make on the level of reports (as new dimensions or new measures), and row-level security by means of our new Business Model Filters.
In more details, in new version you can find:
Major features
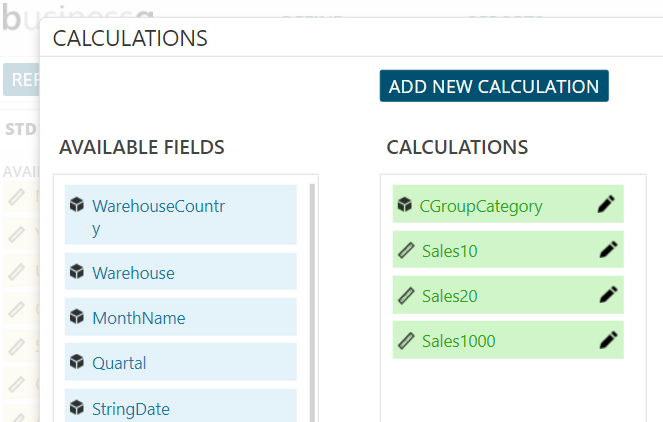
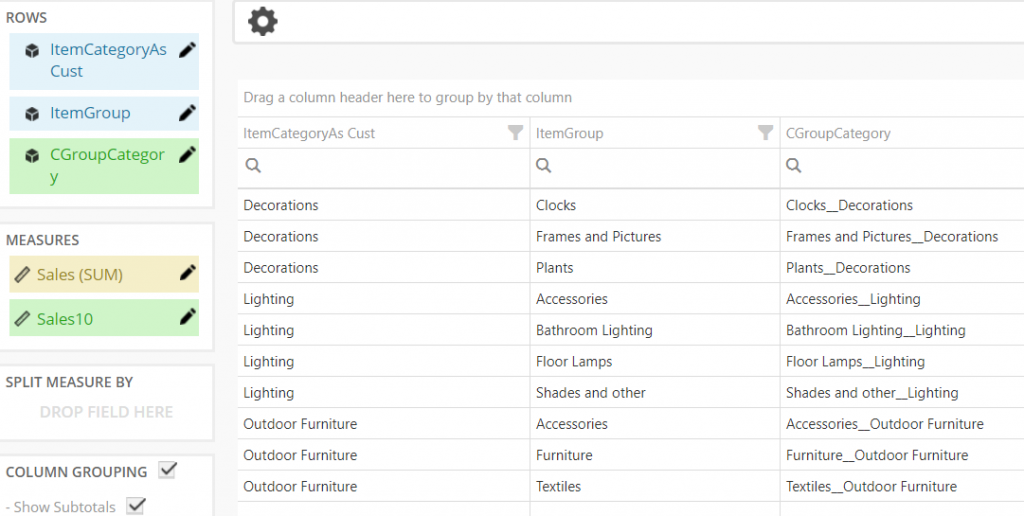
Calculations – Create custom Measure or Dimension fields based on different functions which can then be used in reports like any other available measure or dimension field.
Profile editing – Each user can edit their own basic profile settings
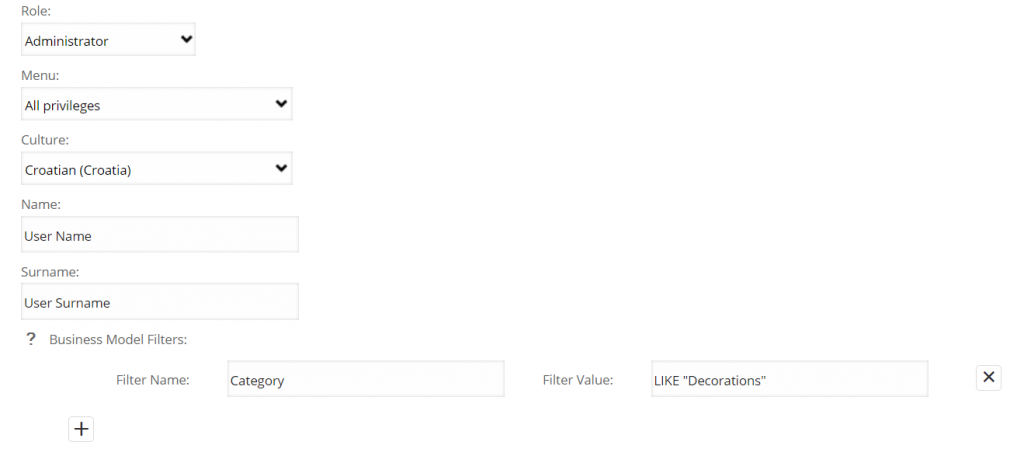
Business Model filters per user– We introduced row-level security in BusinessQ – Data filtering based on Business Model and logged user’s Filter.
Licenses – Now it is possible to create license for every role (administrator, analyst and viewer).
By clicking on “Licenses” in “Admin” part of menu you will see data about licenses
Minor features
Query filter info icon – Tooltip with Query Filter options selected in current report, very handy when you are working with SQL filters;
![]()
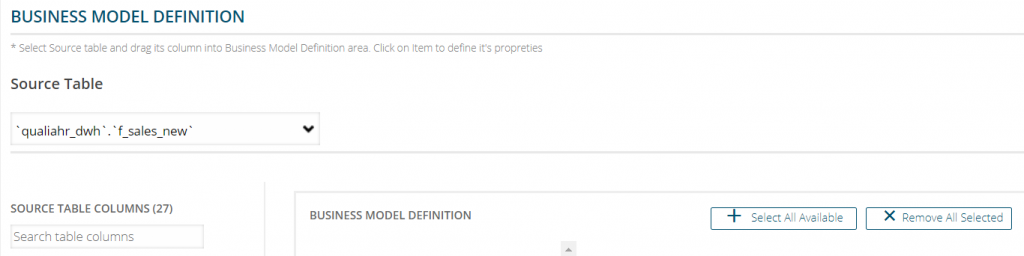
Business model definition – Now you can select all available fields/remove all selected fields and search source table columns
Report and dashboard info icon – You can now easily found report or dashboard info by clicking on info icon
![]()
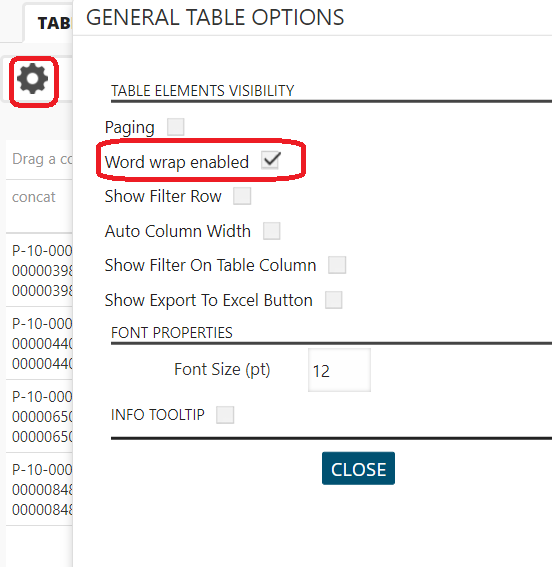
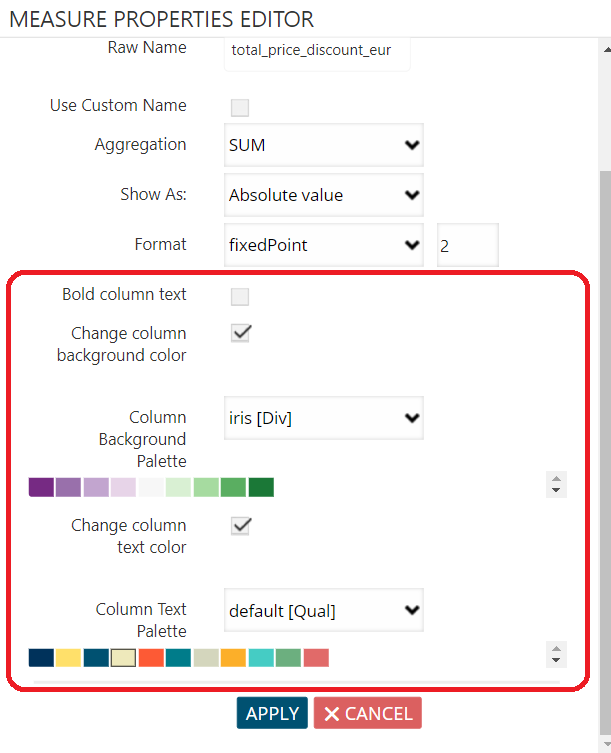
Table visualization – you can now enable / disable word wrap on table visualization, enable bold text in table column, change table column text color or change table column background color.
Public links – Public URL is now available in report and dashboard lists. It can also be found in basic properties of report and dashboard.
CSV report – It is now possible to track number of CSV reports run (until now it was only possible for Business Model and freehand reports)
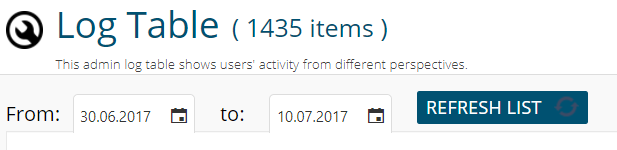
Admin Log table – this list now shows activity between two dates. Initial it shows last 10 days.
Few UX bug fixes for IE
We are developers of data visualization software BusinessQ. Try it for free and make reports and dashboards that makes sense, without chart junk.
Related posts