Best practice tips to successfully implement BI tools in 2019
We have noticed that most the companies now days aren’t absolutely sure how to start with implementing business intelligence tools. Here are a few tips that you may find helpful.
You have to decide which software to use. Not all solutions are the best solution for everybody. Every type of business and every company has its specific needs, so as almost every business intelligence software offers features they find the most important for successfully visualize the data and enable the decisions makers to do their best performance.
Finding the right solution for your problem is one of the most important steps. In that process, you should define your needs, be conscious of your data and what can be displayed from your database. Once you have those answers, you can start searching for the right solution for your business.
We would recommend you to start with a free trial which is offered by almost all the vendors.
Besides finding the right tool, you should also prepare your team to be open to new solutions. Any member of your team should not ignore the innovation you’re trying to implement.
As is always in life, every beginning is hard. You should test the solution you’re trying to implement as much as possible. Also, you have to organize good implementation and to encourage other employees to introduce business intelligence tool in their every-day routine.
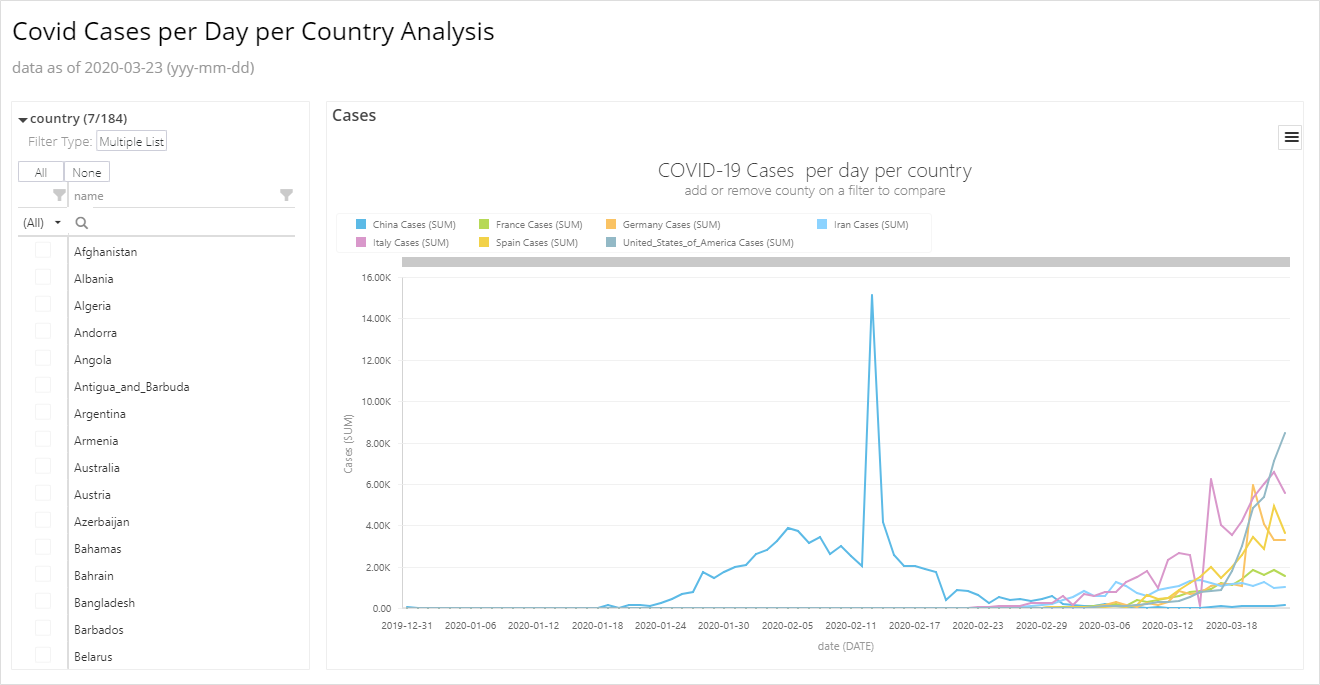
As best practice shows, in the first stage of getting used to BI tool, it is better to have fewer data and visualizations to follow then more. The reason is that if you and other employees have too many data to keep an eye on, and you’re not used to doing that, it’s not so hard to get lost in information.
In developing our BusinessQ software, we took great care to how data is visualized. there is no chart junk, no misleading charts, just clean, best practices DataViz. That should help in BusinessQ user acceptance in your company.
Our recommendation is to become familiar with KPI Matrix and KPI Cards as soon as possible. It will make your life easier in the future.
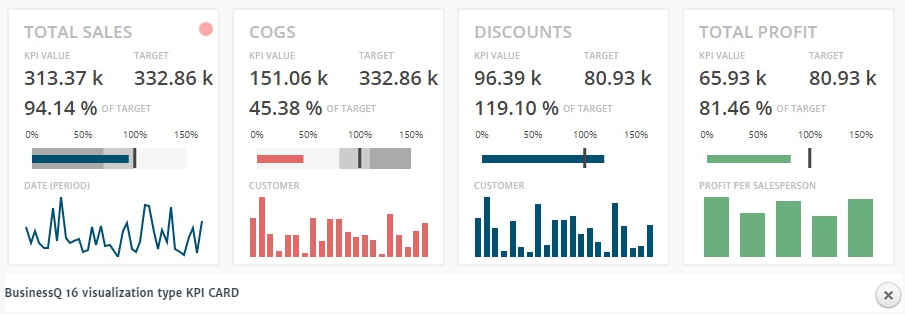
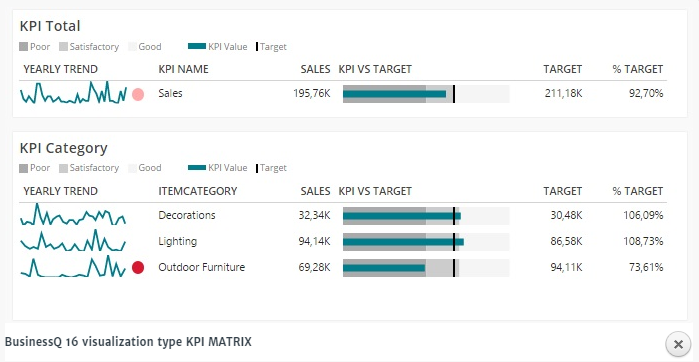
With KPI visualizations, you’ll be able to keep track of the most important data in your business. Furthermore, with good KPI visualizations, you’ll be able to notify trends and how far from the target you actually are within seconds.
Stay tuned – more about KPI will be posted soon!
If you have second thoughts or need assistance to decide whether BusinessQ is the best fit for your business, please let us know, we will be more than happy to assist you! Also, if you have any questions or suggestions, write to us!
We are developers of data visualization software BusinessQ. Try it for free and make reports and dashboards that make sense, without chart junk.
Related posts