Why do I think that dataviz is form of art?
Design and creation of business information dashboard is not an easy job. That is why there is a whole set of rules to help you achieve your goal - to…
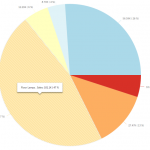
When is pie chart better than bar graph?
Yes, it is true. There ARE situations where pie chart is better way of displaying quantitative information than bar chart. We already, like many others, wrote about "evil" pie charts.…
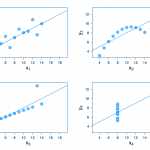
The power of data visualization: Anscombe’s story
The concept of using graphical representations of data instead of just plain tables was actually a hard to sell 10 or more years ago. At that time the most important…
Data Visualization – what are the benefits?
Data visualization. The term which is more and more spoken of, but I have a feeling that many people lack the real definition or real feeling about what data visualization…
When to use Bar, Line or Area graph and Why?
If you are report builder, you probably often ask yourself - which graph is the best to visualize my data - area graph, bar graph, something else ? Report builders…
The future of business data visualization
Today is a big day for us. We’re thrilled to announce that our data visualization software, SaaS BusinessQ 16, is here. We were very busy in the last months to…

