Whether the type of business you are in, customers are your backbone. Without customers, no…

Minor changes in May
Hi all,
We hope you are all doing well. We continued working hard to make the Analytics app even better and more suitable to our user’s needs.
Let’s go through small fixes & changes we just put live.
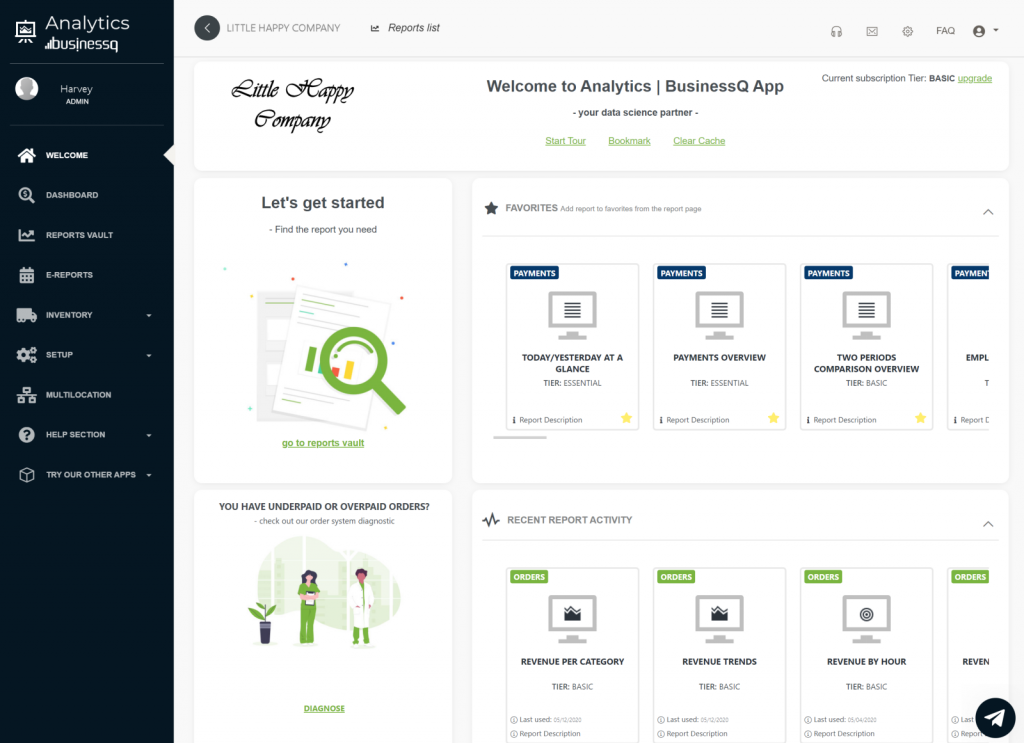
Welcome page redesigned
To help to onboard new users we redesigned the welcome page and made some minor changes like
- direct access to Reports vault
- profile data moved to the top menu
- favorites and recent report activity sections expanded by default
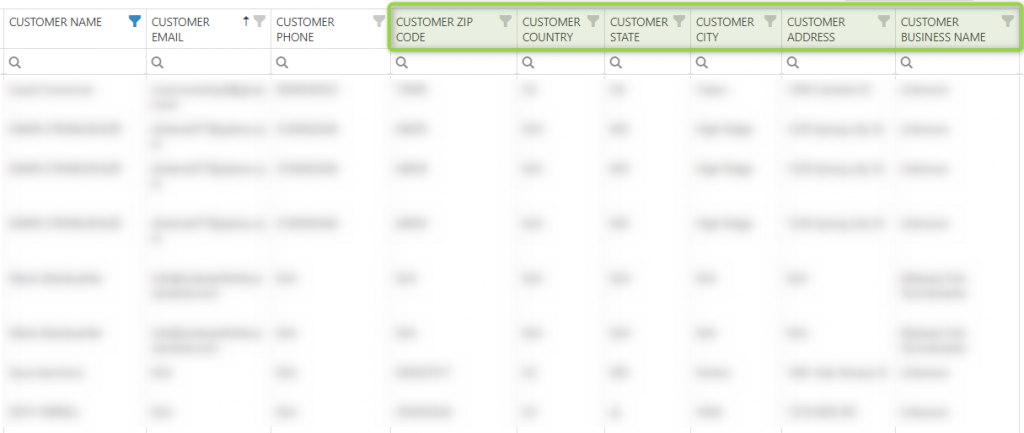
More customer data
We’ve enabled more customer data information on several reports.
For instance, new customer data that are now available are:
- Post Address
- State
- City
- Zip Code
- Country
- Business Name
That data can be found in the following reports:
- Full Orders details
- Orders with Items details
- Pivot Order level data
- Pivot Item level data
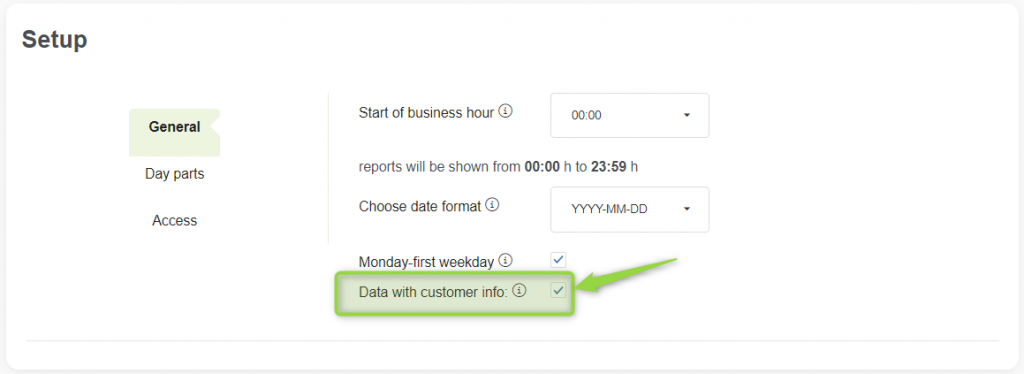
What do I need to do to see customer data in Analytics?
It is very simple. To see all available customer data information, you only need to activate the option “Data with customer info”.
This option can be found in the General settings/Setup page. Analytics comes with an unselected option by default. The reason for this is in a possibly huge amount of data that Analytics will pull into reports, especially when it is done for the first time. So, use it, but be wise, if you don’t need this information on a daily basis, better to have it non-active.
When it is active, it is valid for all the reports that contain detailed customer information like Revenue per Customer, Full orders details report, Orders with items details report plus Pivot Order, and Pivot Item level data report.
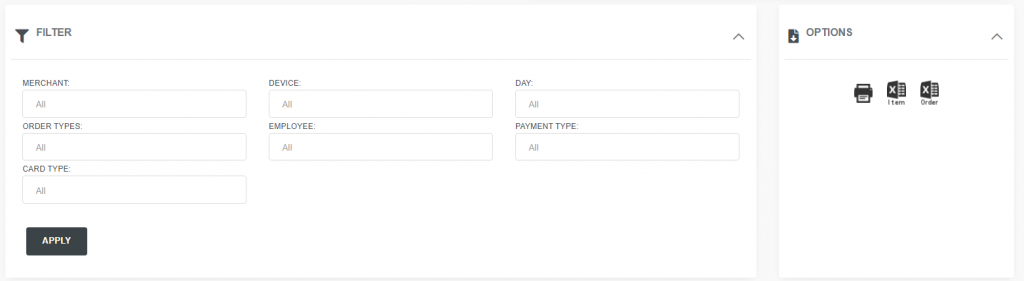
Filters and options
Since publishing newly redesigned Analytics, many users didn’t see additional filers and options sections in reports. Therefore, we have decided to make a change and now they are always expanded by default.
Printing reports
With this Analytics version, we fixed the problem when printing reports Menu will not be visible on printed reports any more.
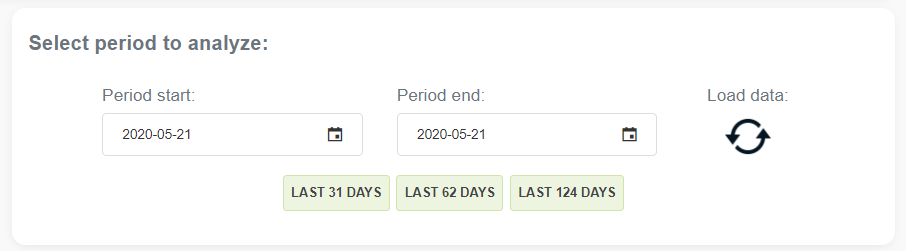
New quick time buttons
The report “Average Sales per Day and Hour” in the Advanced section now you can analyze up to 124 days (4 months). For easier data retrieval, we added 124 days quick-time button. Now you can easily check your average sales data for the last 4 months.
As always, we want to hear any suggestions you may have. After all, we are building this app for you.
We hope that you are as excited about the new changes as we are.
Have any new ideas or suggestions? Write to us!
Happy Analyzing!
Your Analytics | BusinessQ App Team
Related posts


