Whether the type of business you are in, customers are your backbone. Without customers, no…
Top 10 reports you should use for your Restaurant Business
It has never been more challenging to run a successful restaurant than it is now. Above all, we all live in pandemic and post-pandemic times, and it is crucial to adapt fast to the changes.
Delivering great food and an excellent customer experience is essential. You also need to constantly analyze and work upon your strengths and weaknesses to stay ahead of the competition, but you already know that, don’t you? I’m not here to discover hot water, only to show you how you can use Analytics to help run your business successfully.
This is where the role of data and reporting, and analytics come into the picture. Therefore, we at Analytics BusinessQ app prepared some reports, especially for restaurants and their needs. Knowing the most crucial ones you need to monitor daily is essential.
Those reports will enable you to keep a sharp eye on your restaurant operations. In addition, with that, you can make the required modifications in the fields that are not performing that well and can boost your business in the future.
At the Analytics app, we recommend using some crucial reports where you can find valuable information that we keep track of your business. Here are some reports and analyses that you could regularly use to monitor your business:
- Revenue per daypart
- Revenue by hour
- Employee overview
- Stock value report
- Today’s performance
- Master summary report
- Revenue per Employee with Shifts
Besides reports that all businesses are using, there are some reports designed especially for restaurants or similar food and beverages services:
- Cover trends
- Dwell time report
- Modifiers report
So, let me show you a bit more on some of those.
Dwell Times Report
Are you sometimes wondering how much time your customers spend at your store? Dwell Times report is a report that shows time in-between order creation time and order payment time.
Using this report, you can check day-by-day dwell time. For instance, if you find that your customers spend too much time, speed up the service. Or maybe, your customers are not spending enough time. In that case, make some changes so they could stay longer and spend more. The information is here for you; you only need to use it for your benefit.
Use the report to tell you you are on the right track.
Cover trends reports
Cover trends report is a solution (workaround) for Clover POS systems.
Many merchants, mostly running restaurants, wish to know how many customers were per order/table, and Clover doesn’t have a natural solution. That’s why we decided to create this ‘solution’ report. So, Cover Trend is a Report that shows Trends and Dates info from Orders created on a selected period.
Before you start using the report, please read the instruction available in the app.
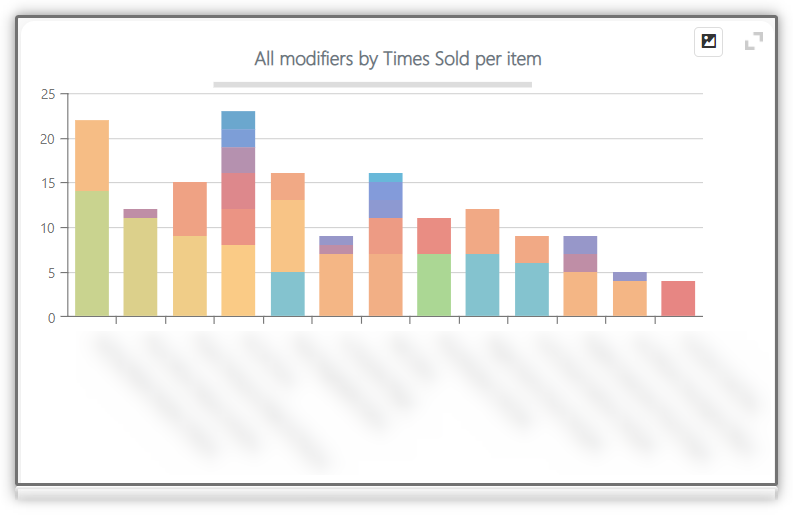
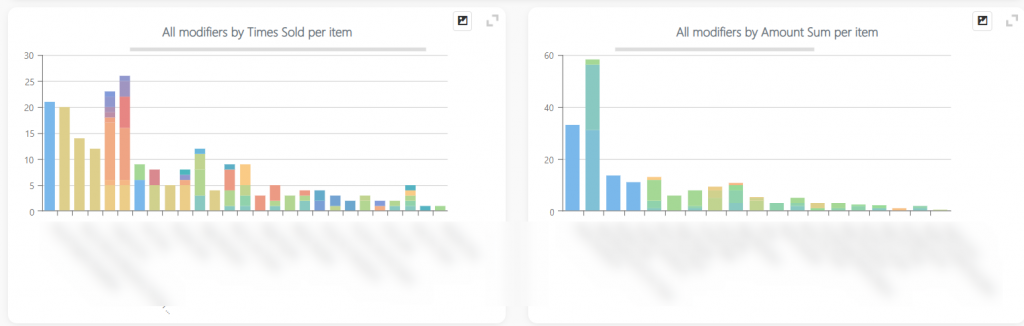
Modifiers report
Modifier Report is a powerful tool for monitoring the behavior of your Modifiers and Modifier Combinations. In Clover, you can define Modifiers that modify the price of Items. This is the right report if you want to track the number of sold Modifiers.
The first two charts are for the Modifiers table. The table shows you all modifiers used in the selected period. Here you will see other essential information like how many of each modifier sells and the overall amount earned.
All mentioned reports provide you with a clear understanding of your business and enable you to make data-driven decisions. Important to say, they all give you real-time data. In conclusion, use as much as you can to make the right decisions.
As always, we want to hear any suggestions you may have. After all, we are building this app for you.
We hope that you are as excited about the new changes as we are.
Have any new ideas or suggestions? Write to us!
Happy Analyzing!
Your Analytics | BusinessQ App Team
Related posts


