Whether the type of business you are in, customers are your backbone. Without customers, no…
Analytics | BusinessQ – Big changes in March
Hi all,
All good things come to an end, but something better and bigger is here!
After months of hard work, we are proud to announce that a lot of great new stuff is already up and running! Without talking too much, let’s go through small fixes & changes we put into production. Now all those changes are available to everyone.
New report menu structure
Analytics has so many reports that sometimes it is hard to find what you need. Because of that, we made quite a big change. Instead of accessing reports only through Reports Vault or via Reports list, now we have grouped all the reports into several groups.
Now you will see two main sections.
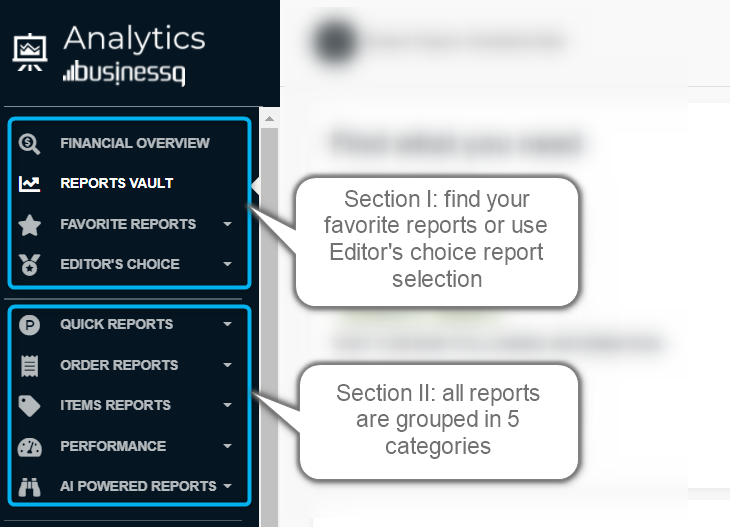
Section I
In the first section, you will find:
- Financial overview – in the Financial overview you will find several most important KPIs for any business. Here you will find data for Gross amount, Net amount, No. of orders, etc. and all that compared to last week and last year.
- Reports Vault – if you are not sure what report you need, or you are looking for something new, Reports Vault is a place for you. Search for available reports by report type, report function, or check reports you have in your tier.
- Your Favorites – every report you like and want to have fast access to it, mark it with a start and you will always find it here; no need for searching.
- Editor’s choice segment – here you will get all Analytics’ most important reports for your daily reporting needs. Here we set reports like Master summary, Today’s performance, Pivot level data for creating custom reports, and some others too.
Section II
The second section, consist of all reports grouped into several groups, like:
- Quick reports – fast loading reports, payment-based and long periods of analysis. For example, here you will find, Payment Overview, Item Categories Overview, ThreeMap, etc.)
- Order reports – all reports that give you order level information (for example Pivot Order Level data report, Orders Overview, Revenue Per Employee, Revenue per Merchant Location, etc.)
- Item reports – all reports that give you item-level information, for example, Pivot Item Level data report, Orders with Item details, Revenue per Item, Revenue per Category, etc. Many merchants use many of those reports regularly.
- Performance reports – different comparison and performance reports and analysis with a focus on time and performance. So, here you will find reports like Revenue per Hous, Revenue per Day in a Week, Revenue per Daypart, Day vs Day performance, and many other very useful reports.
- AI-Powered reports – new and first time on Clover! Here you will find reports powered by AI and Machine Learning models like RFM Customer Analysis, Business Forecast, and ABC Product Analysis.
Professional Tier
Most of our work recently was focused on a new Professional tier. In the Professional tier, there is no strict limitation on the period you can analyze each report. Because of that, now all reports are available for a year or even longer. Ten years if you need it at once! Yes, this is true, we are not joking!
But, the Professional tier is much more than a new tier in the Analytics app that offers an unlimited analyzing period. For the first time, merchants using Clover POS, have access to reports based on AI and Machine Learning algorithms.
At this moment, here you will find three new AI reports. Let’s explore what you can find here…
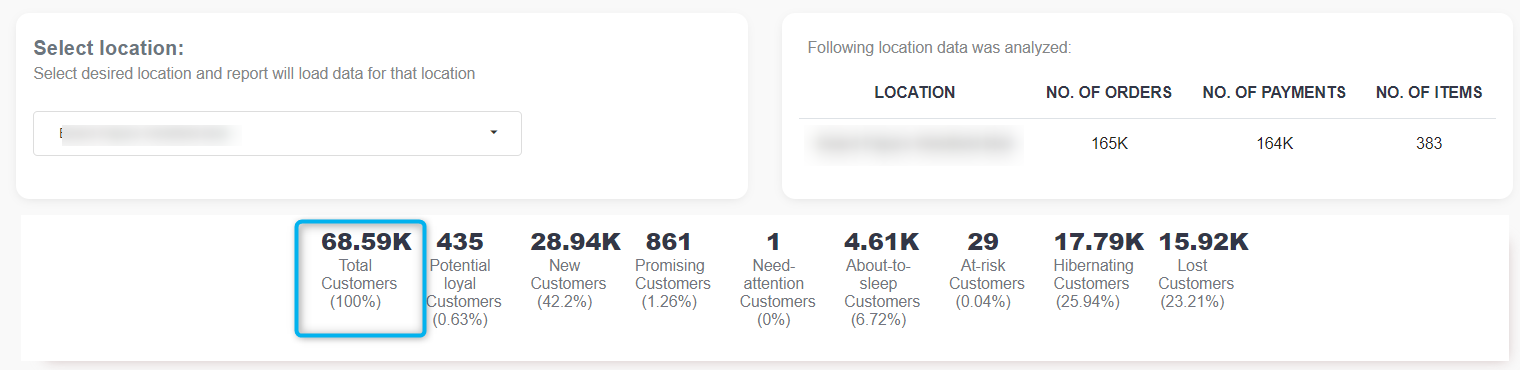
RFM Customer Segmentation
Most of the questions we receive are about customers, their data, and purchasing habits… what, when, how many. Wouldn’t you love to be able to identify groups of customers and their purchasing habits? If you know each group, you can tailor your marketing strategy to target each group. For instance, with personalized offers, you can increase profit, improve unit economics, etc.
RFM Analysis done by machine learning algorithms saves you an enormous amount of time. Above all, it calculates something that manually you wouldn’t be able to. When you have this data, you are able to use it for many purposes, like:
- Identify specific groups of customers
- Target them for marketing activities
- Promote repeat purchases and loyalty
- Acquire new customers
By using Analytics RFM Analysis you can know exactly how many customers you have in each RFM segment. Besides getting detailed numbers, you can find each customer with their data. In other words, based on that information, you will be able to target each customer with a specific and customized strategy.
For more info about this report, just click on this link.
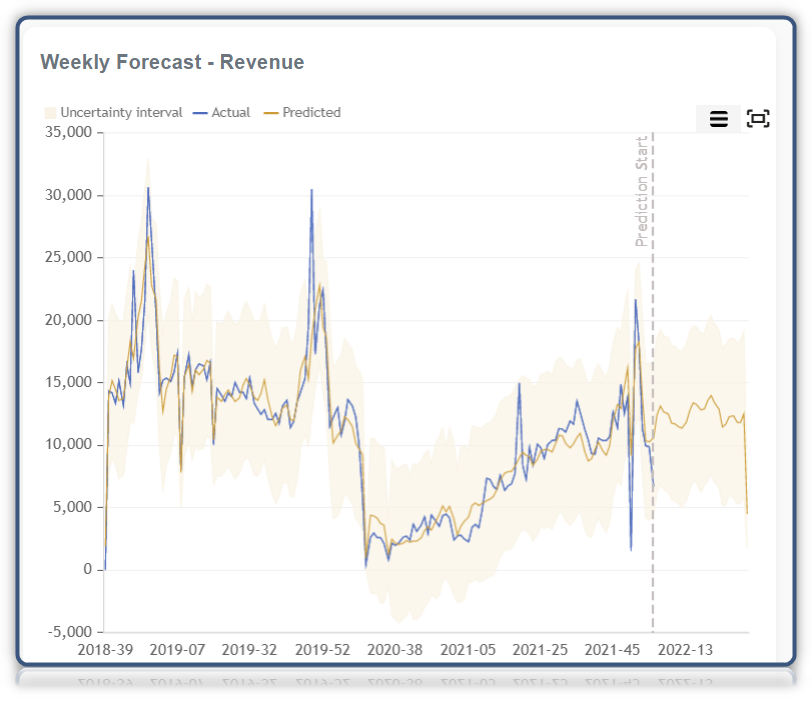
Business Forecast
Sales forecasts bases data on different historical information taking into account various effects. Businesses use the sales forecast to estimate weekly, monthly, quarterly, and annual sales totals.
Just like a weather forecast, your team should view your sales forecast as a plan to work from, not a firm prediction. Calculation of the forecast could be in different ways, but without powerful machine learning programs, it is hard to be accurate. That’s why we prepared it for you!
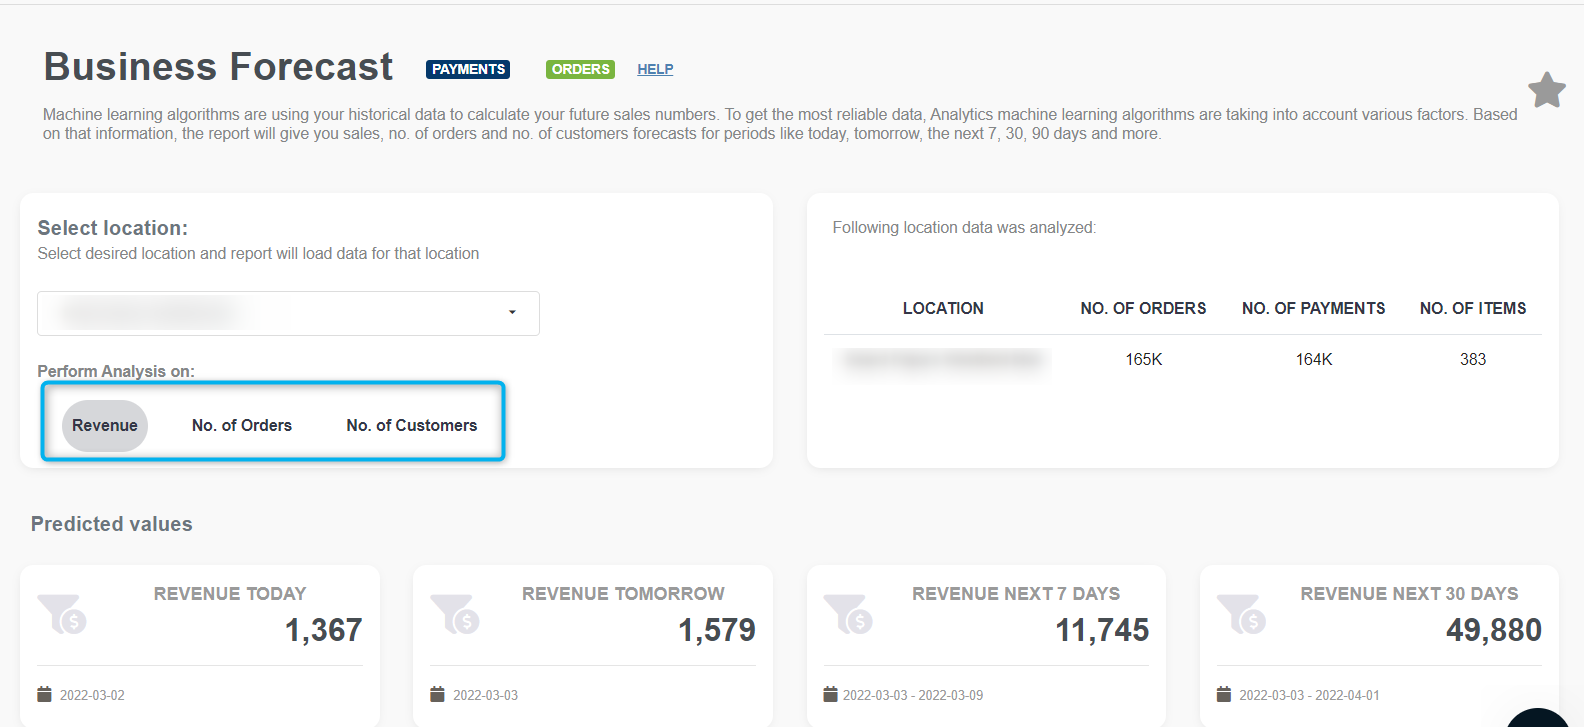
Using Business Forecast analysis, you can use to get data for:
– Revenue
– Number of customers
– Number of orders
Besides that, Forecast and Trend predictions analysis offer you several charts. All those charts, you can view based on:
– Daily values
– Weekly values
– Monthly values
– Yearly values
If you want to read more about it, click here and you will get all info you need.
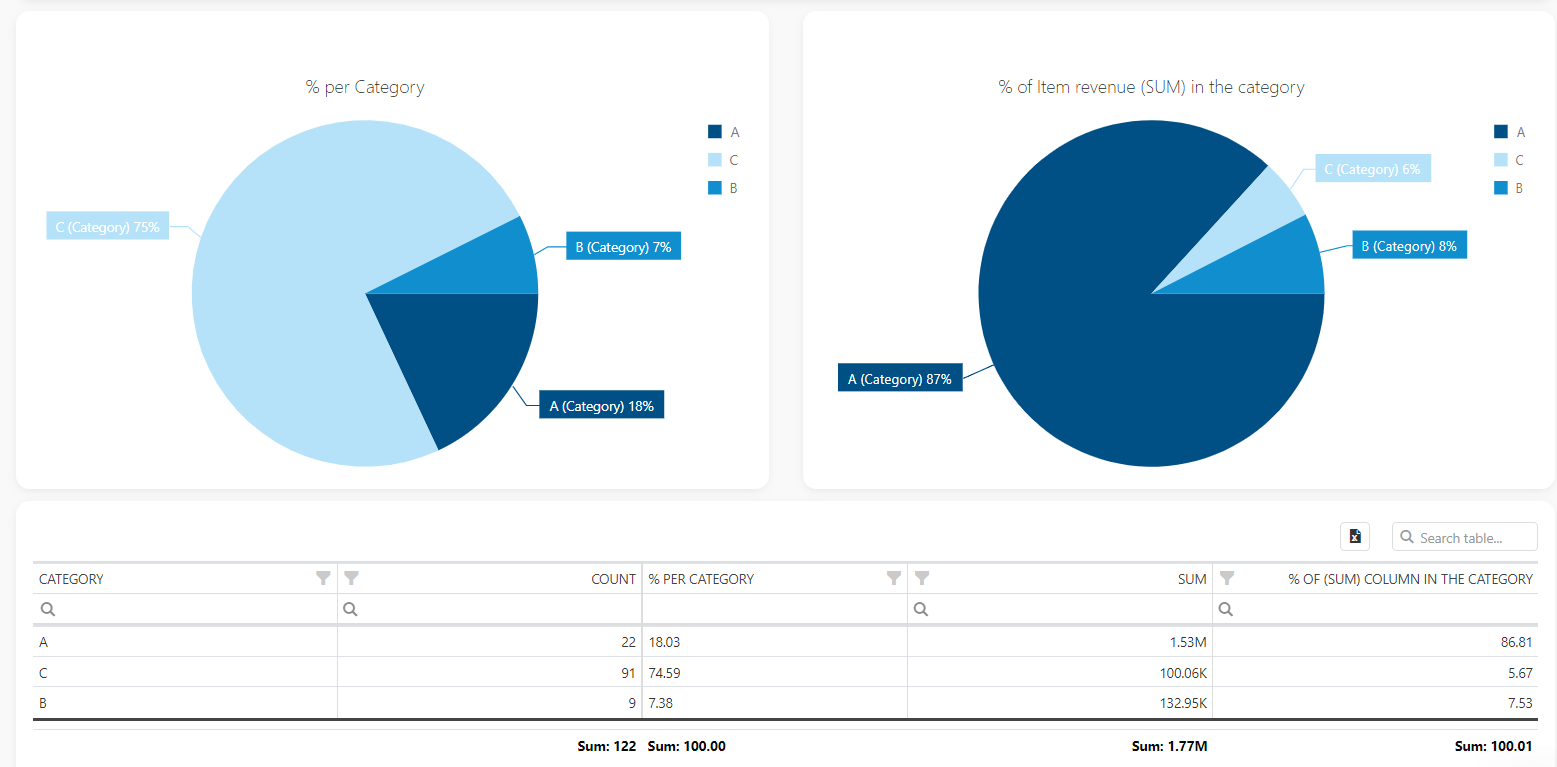
ABC Product Analysis
There are tons of reports where you can find out what is your best-selling item in a period… but what if you would know a group of items that contributes to the sales the most, not only one or two items, but a group.
ABC analysis is a classification method in which items/entities are divided into three categories, A, B, and C. The ABC analysis is also called Pareto analysis. The Pareto analysis says that 80% of the results (output) come from 20% of the efforts (input). Some of the benefits of using ABC analysis in your business are improved inventory optimization, forecasting, reduced storage expenses, etc.
If you think this is something you would like to try and get more info on it, please check FAQ Pages.
Improved Pivot Tables
For many merchants, Pivot tables are those that make a real difference in reporting. This is especially important if you have more locations and want to see data all at once. With Analytics pivot tables, you are able to see data in the way you want.
In the Analytics | BusinessQ app, you can choose between reports based on:
- Pivot Order Level Data
- Pivot Item Level Data
In each Pivot section, you can create up to 20 custom reports, each exactly how you need it. In total, this is 40 more reports, to already 40 predefined reports!
As this section is very important for many merchants, we made some important changes for a better user experience. Changes we made:
– grouped data (Customer, Merchant, Date, Item, etc.),
– metrics section is separated,
– search all available data fields,
– faster data load, etc.
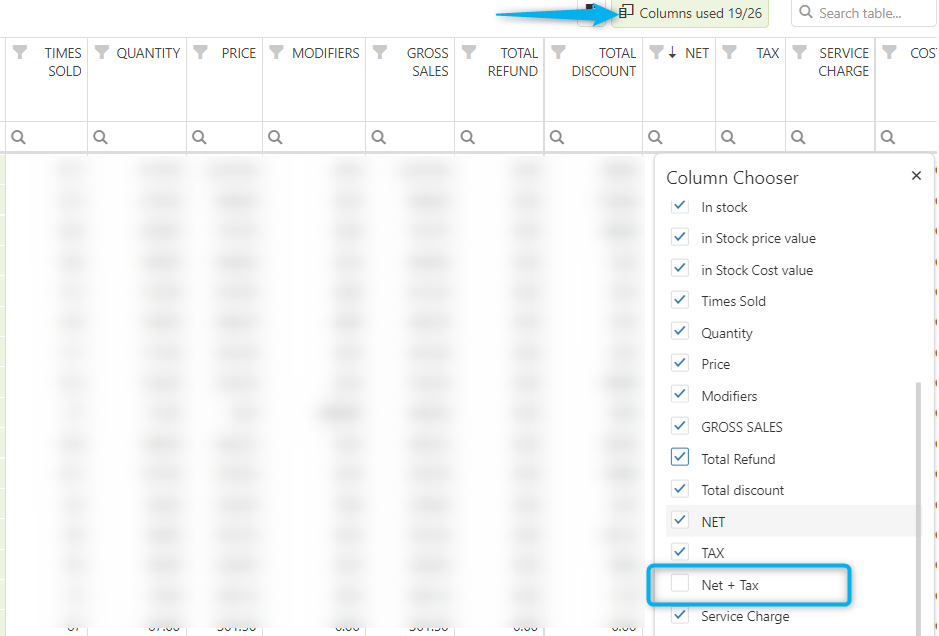
New column “Net+Tax”
New column “Net+Tax” added to Item-based reports. This column is added to the detailed tables in Revenue per Item, Revenue per SKU, Revenue per Category, Revenue per Tag, Orders with item Details, and Items Tags Category analysis.
The column is not automatically visible. If you want to see it, open the column chooser and mark it with a checkmark. After that, the column will be in your tables.
Besides all we said, here are many small changes, added columns, or values that will make your experience with the app even better.
We are super excited about these new changes! New and more intuitive analyses and reports, are here to make your everyday life easier!
As always, we want to hear any suggestions you may have. After all, we are building this app for you.
We hope that you are as excited about the new changes as we are.
Have any new ideas or suggestions? Write to us!
Happy Analyzing!
Your Analytics | BusinessQ App Team
Related posts


