Whether the type of business you are in, customers are your backbone. Without customers, no…
DWELL TIME REPORT
What is Dwell time?
Dwell time is measure on how long people are likely to spend on something. This could be time spent looking at an advertisement, time spent on some web page or time spent in a store. In other words, it is a key performance indicator (KPI) for many businesses – especially bars and restaurants.
Dwell time associate with various relevant metrics. Some of those metrics are customer satisfaction, shopping experience, and interesting content. Above all, in the end, it reflects on sales.
Measuring dwell time can give important insight into your business performance. In other words, it reveals potential fields for improvement and growth. Since it has an influence on sales volume, this is a measurement any business owners should be aware of.
How can Dwell Time influence sales?
Customers who feel comfortable in a store, stay longer and buy more. But at the same time, longer dwell time in a store or a restaurant isn’t a necessary result of good vibes. In other words, longer dwell time could also come from slow service. In that case, longer dwell time will probably have a negative effect on customer satisfaction. Negative customer satisfaction will lead to a decrease in sales volume.
As a result, we can say, it is important to increase positive dwell time. In other words, only positive dwell time will have a positive effect on sales. If customers have a good shopping experience, they could spend more time in-store or more time at the table.
In conclusion, they’re more likely to buy more and make some spontaneous purchases. In a restaurant, customers could order extra coffee, drinks or desserts. That all could lead to an increase in sales volume.
Why did we decide to create this report?
Many merchants, especially restaurants, wish to know how long do customers spend in their restaurants. As far as we know, Clover POS doesn’t have a real solution for this, so we decided to create this ‘solution’ report. Our main goal is that our users get most of the Analytics as a reporting tool. Creating a new report based on customer needs is exactly matching our goal for our app.
A bit about the Dwell Times report
The Dwell Times report is only available in the Advanced tier.
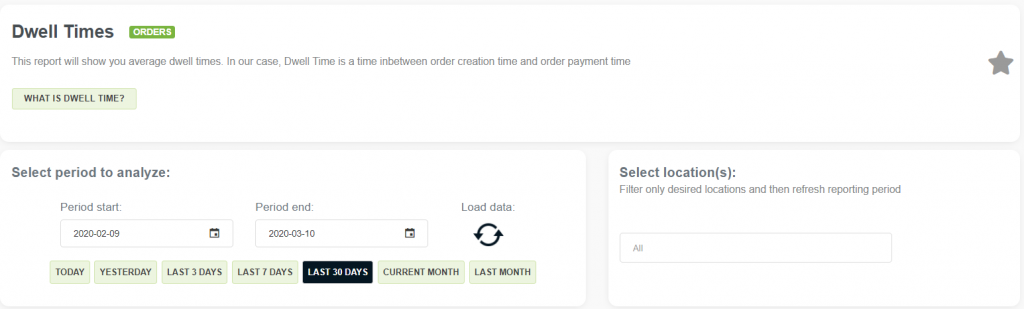
It shows time in-between order creation time and order payment time. As most of the reports in Analytics, this is a classic type of report with usual report sections.
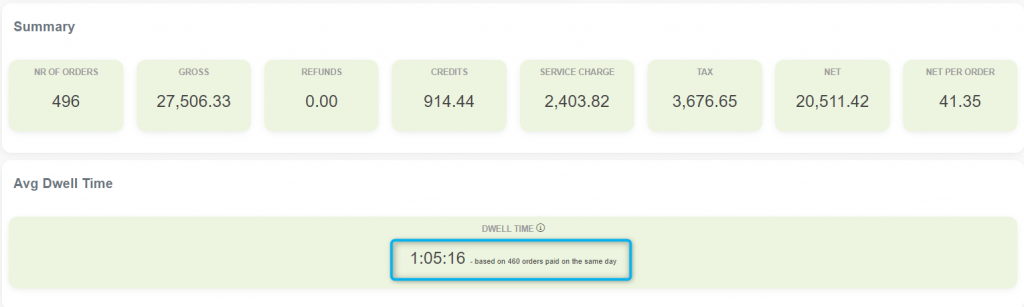
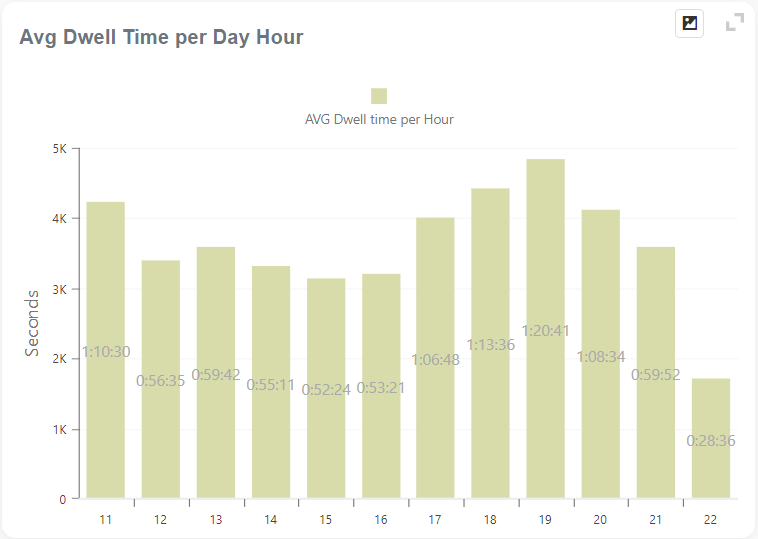
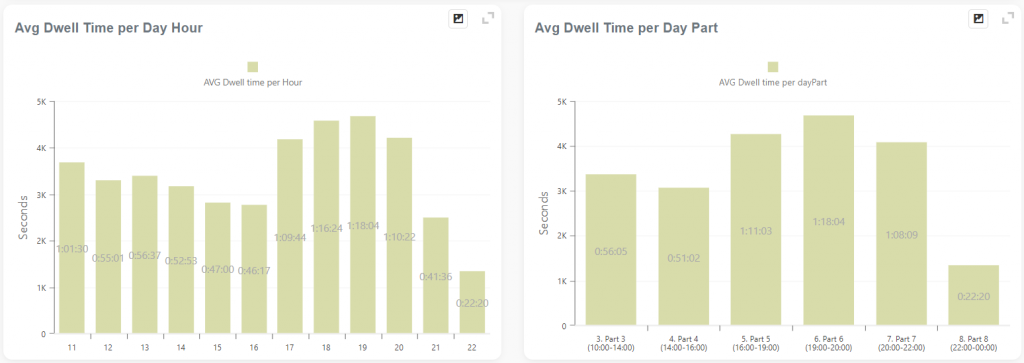
Besides the summary in this report, you can find charts and the table with detailed information. In charts, you can find information about average dwell time per day hour and daypart.
At the end of the report, there is a table, where you can see listed all orders with information like order creation date & time plus payment date & time.
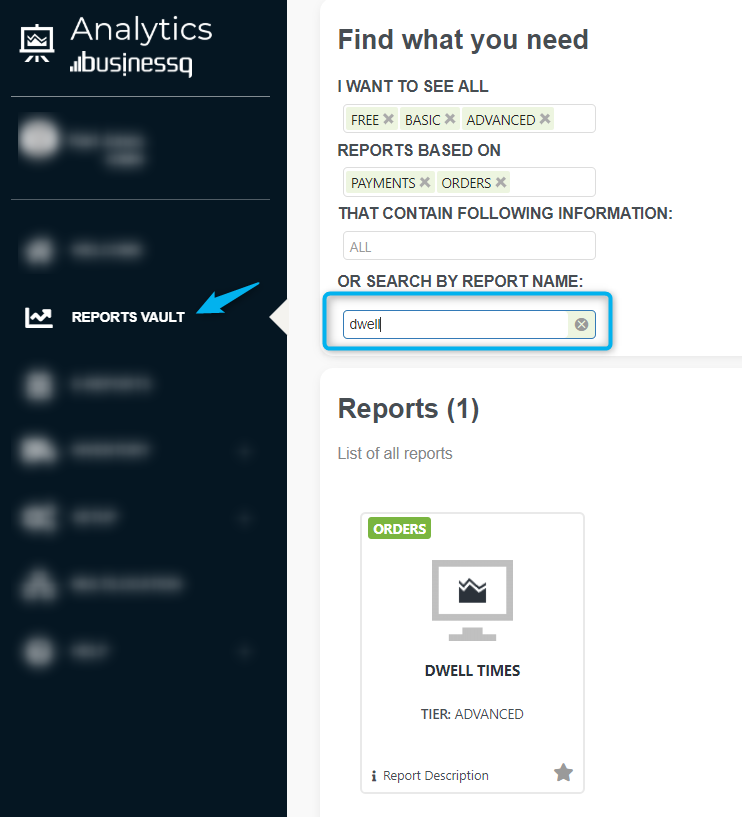
How to access Dwell Times report?
You can access the report in several ways. The first way you can access it is by selecting it from the menu on top of the screen (Report list). Also, you can press the right mouse button to open a quick menu or searching for report via Reports Vault page:
If you would like to know more about the report and its prerequisites, please check the FAQ page.
As always, we want to hear any suggestions you may have. After all, we are building this app for you.
We hope that you are as excited about the new changes as we are.
Have any new ideas or suggestions? Write to us!
Happy Analyzing!
Your Analytics | BusinessQ App Team
Related posts


