Whether the type of business you are in, customers are your backbone. Without customers, no…
All changes so far in 2019
Hello everyone,
We are informing you about changes that we did for BusinessQ Analytics App for Clover so far in the 2019
Whether you are using using Analytics from time to time or on daily basis, you should read these changes as you might find something useful!
Date Format
The first notable changes started with a request from our customer. It was a merchant based in EU and current default date format was confusing him.
So we have added an option that can be changed in General settings pop up on the welcome page.
By default, the date format is set to be YYYY-MM-DD but now you can choose to have an additional two formats that will apply throughout the whole application.
Steps to change to the new date format:
- On the welcome page, you can see your currently preferred / or default date format
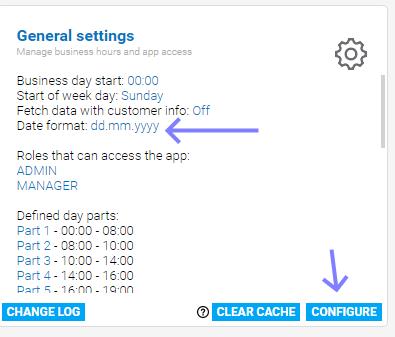
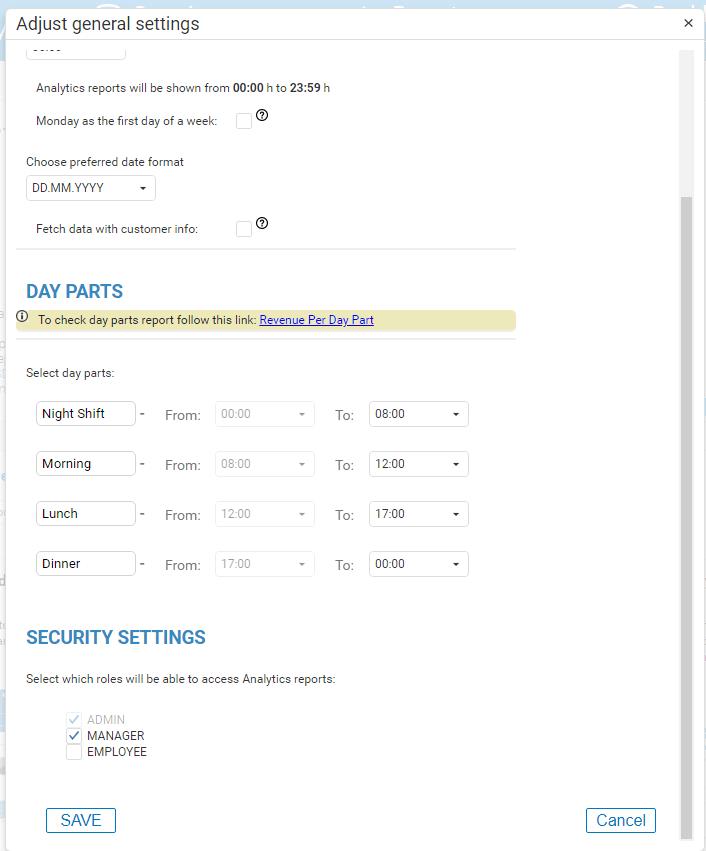
- Click on configure button on the Analytics welcome page to open general settings pop-up and select preferred date format:

- After you have selected your preferred date format, do not forget to save changes. Save button can be found on the bottom of that pop-up. Just use scroller on the right or mouse wheel up/down to locate it:
Selected and saved date format will affect calendar input fields as well as all Analytics reports/charts.
Example for dd.mm.yyyy format
Calendar input fields:
![]()
Charts:
Reports:
 p.s. – Time of the writing this chapter above about General settings was half a year ago. We completly redesigned the look of General Settings pop-up. you will be able to read more about it further below or click here
Improved Modifiers report
We have improved the Modifiers report. Without getting too much into details about processes that are happening ‘behind’ the scene while you are using this report among other things we will just say that its speed was greatly optimized.
Especially after the data was initially cached, which allows ‘smoother’ change of reports as well as no need to select the period you wish to analyze which you were already analyzing on some other report.
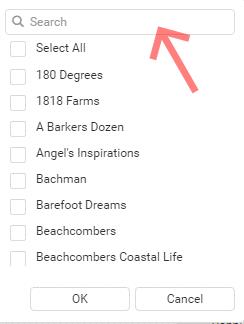
We also added additional filtering where a merchant can filter to show results for 1 or more locations that he has in his multilocation.
And additional 6 charts for three tables on that report.
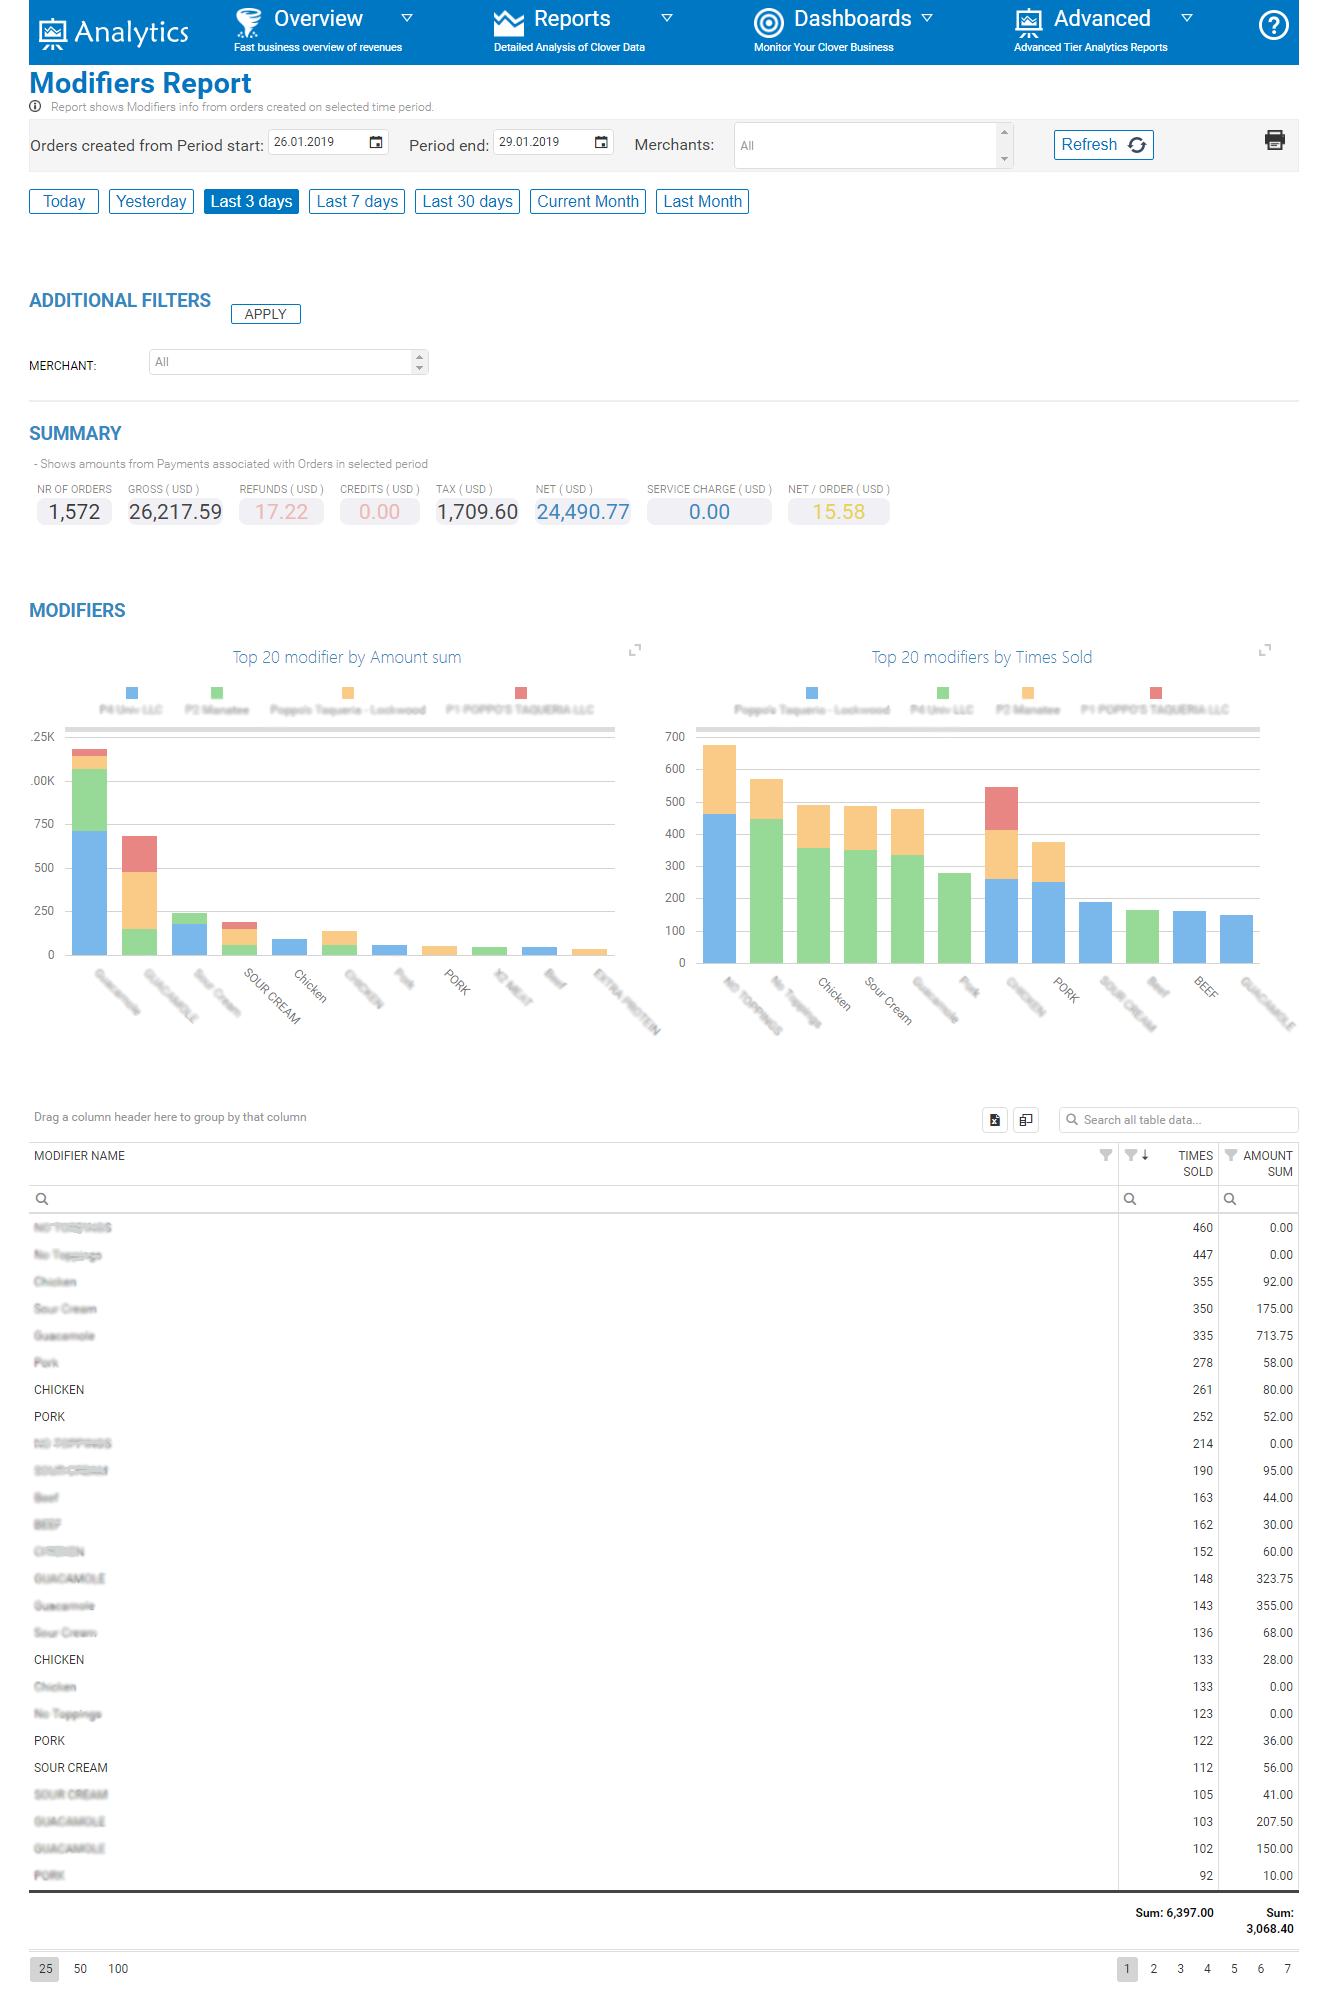
First two charts that we added are for Modifiers table. That table shows you all modifiers that were used in the selected period of time with key information such are how many times each modifier was sold and what is overall Amount sum earned from it.
In the following picture below you can see our demo test merchant that has 4 locations in a multilocation feature.
Both charts will show you the TOP 20 modifiers by AMOUNT SUM (left chart) and TIMES SOLD (right chart). Mouse over the bar will show you additional information like which location it is, and depending on which chart are you looking at, how many times modifier was sold or overall modifier amount earned.
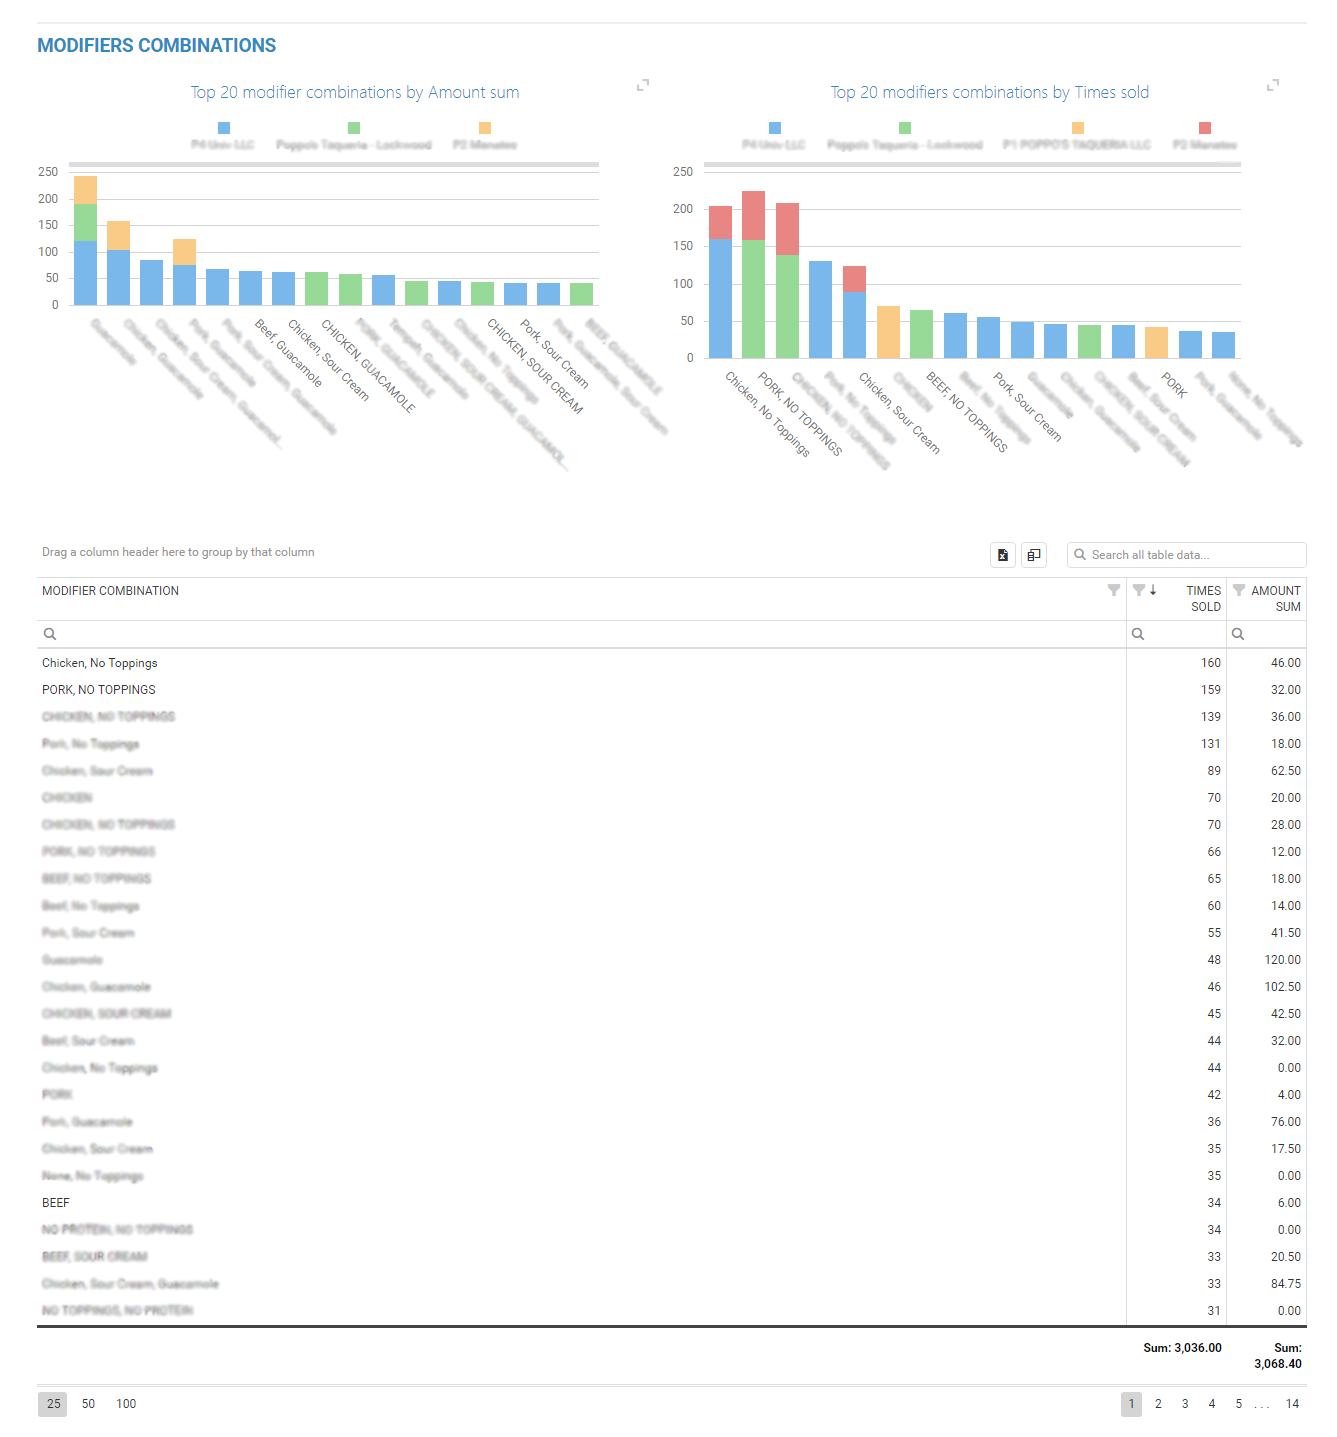
Next two charts are showing visualization for MODIFIERS COMBINATION table, where you can see top 20 combinations from all locations, with a left chart showing you their Amount SUM and the right chart showing you how many times a particular modifier combination was sold.
Just like every chart in Analytics you can mouse over a BAR in the chart to see which location and what modifier combination is in question.
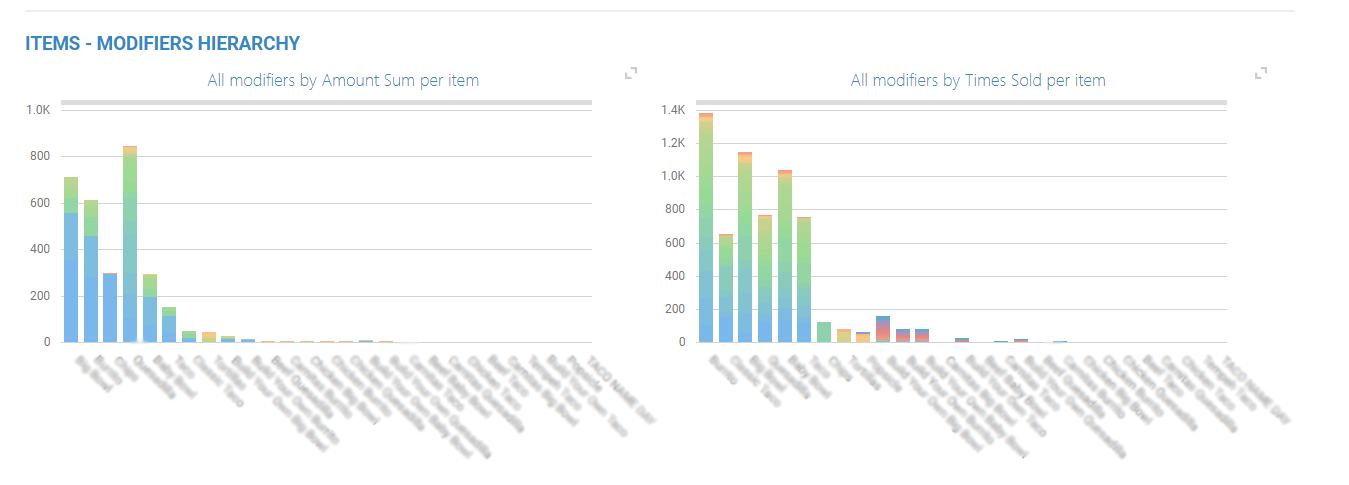
And last fifth and sixth charts are showing visualization for ITEMS- MODIFIERS HIERARCHY table.
That table is grouped to show you ITEM and all of the modifiers that were ‘used’ on it in the period of time you are analyzing. So, the left chart will show you all modifiers amount sums that were used on a particular item(s) whilst right chart will show you all modifiers on items but with information of how many times that modifier was sold.
Other changes/fixes
Welcome page
We have improved General Settings ‘box’ on the welcome screen by adding a scroller on the right side. Scroller was necessary as we plan to add additional settings for users in the future, for example, users will be able to select Analytics App language.
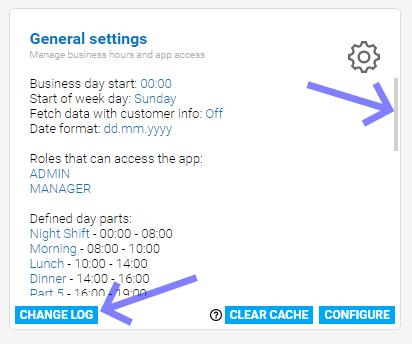
On the same ‘box’ we have added a new button called ‘Changelog‘ which opens a basic text file where we (developers) will write up brief changes that occurred in the current dated version. This way our merchants can spot possible features that were added which could be of use to them (If they wish to read more, they can always visit our web pages).
Also, we improved ‘CLEAR CACHE‘ button to clear local browser storage.
A lot of times our merchants use reports and perform various searches/filters on the tables or resize/add/remove columns.
All of these settings stay saved in local internet browser storage of our user.
Now when you press Clear cache button, all tables/filters/search entries will be reverted to the default state.
We added that because few merchants contacted us that they load report and they can see SUMMARY info but tables on reports are empty. (they are empty because they had table filtered by some specific item that wasn’t sold in this period they were analyzing, thus showing NO DATA message in the table)
Merchants sometimes forget that they have filtered table and then this option will help restore things to their default values. Rather then us sending pictures to our users showing them how to clear local storage on 4-5 most popular web browsers.
Automatic emailing
– we have added three new reports that can now be emailed to your address at a specific time. These three reports are by far most detailed reports from the current list.
We called them:
You can download an example of these reports above by clicking on them.
For the whole list of available email reports please click here.
Also, read further to find out how we advanced this report even more so users can choose on their own which information to receive on the email !
Pivot order/item reports changes
New columns added (all by request from our merchants) to column/field chooser:
DateTime,
Order Payment Net with Tip (Merchant doesn’t want to calculate by hand NET plus Tips),
Order Payment Net with Tip and Service charge, (similar as above)
Half-hour (Now you can group table with half-hour column, which will show you all orders that happened in first 0-29 minutes or 30-59 minutes),
Dwell(shows time difference from creation of order to order payment)
On Pivot order and Pivot item reports, you can now easily use search filter on each column for quick search/filter!
Fixes done to saving the reports. Before, if you checked/unchecked one of the table options it wouldn’t stay saved after pressing save tables button.
Report generic names (TAB1,TAB2) are changed to actual name of the report written by user.
Added option to check/uncheck – Show column totals
Stock Value & Inventory management fixes
We have fixed Inventory Management item count. When merchants saved inventory settings (min/max quantities) but eventually deleted from Clover some of those saved items we would keep those items in our database which have resulted in the bigger stock count than it should of. That is fixed now. After every refresh, we will check if the items are deleted and remove them from the table.
We have fixed Stock Value reports item count as well. The summary would show item count even for deleted items. That is fixed now. The summary will show you a number of items that are not deleted.
In the table you would still able to see ‘deleted items’ but you can use ‘Deleted’ column from column chooser to show/filter only items that are not deleted.
Changes in General settings
In general settings pop-up, merchants can now use a checkbox to select whether they wish to fetch orders with customer data.
Fetch Customer Data – If checked and saved, you would be able to see customer name, email address and customer phone number if it exists on the following reports; full orders details report, orders with items details, pivot item/order level data reports and Revenue per Customer.
If you do not need customer information from orders, we suggest leaving it unchecked as it can, depending on the number of customers, greatly increase the time of initial caching of data from Clover.
By default on report Revenue per Customer you would be able to see the customer name if the cardHolder field is specified on the payment, but Fetch customer data needs to be ON if you wish to see their telephone numbers or email addresses and their name for sure if the field cardHolder name isn’t specified. So, to be sure, just check it on in general settings if you need it.
Also, general settings got complete redesign where options available to change are now available in TABS:
General Preferences (general settings),
Day Parts (used on revenue per day part report),
Permissions ( which role can access analytics (admin,manager, employee)
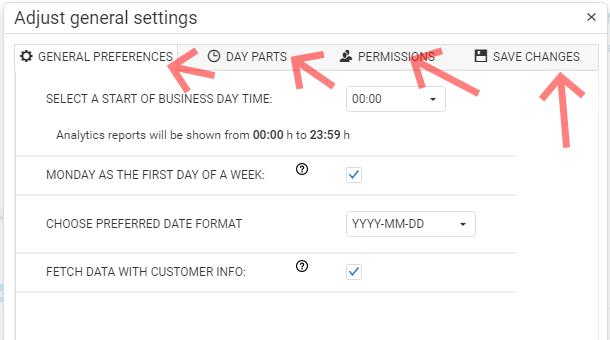
And button for SAVE changes as a LAST tab. Redesign was done because of that save button, customers often didn’t realize that there is a scrollbar to get to the SAVE button. Now it is visible all the time.
Some more changes:
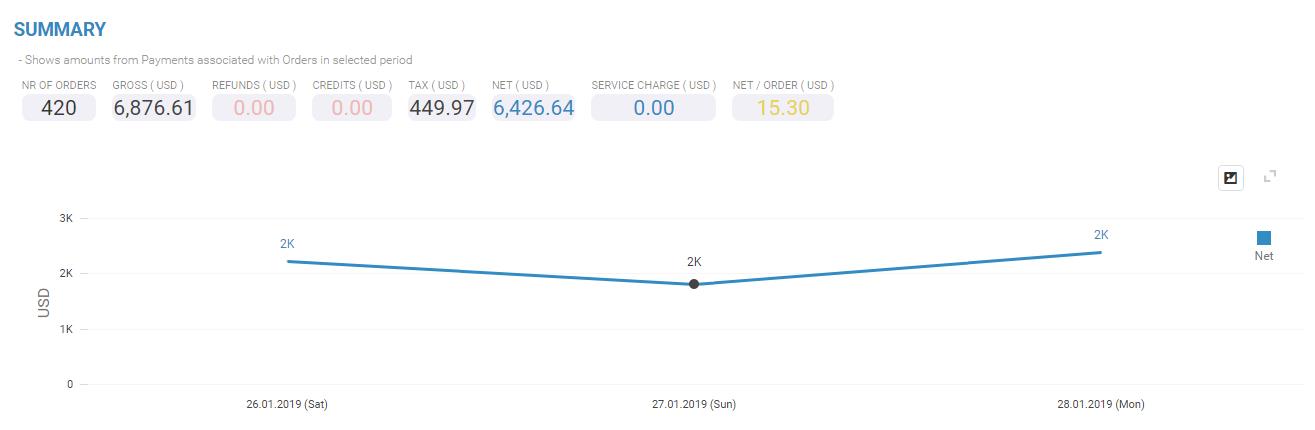
Speed optimization on Orders with items details report and Discounts report. Also, both of these reports got ‘order’ summary at the top of the page.
We fixed the timezone issue on column date on Revenue per trends report.
Quantity field. Analytics now supports Item quantities on many different reports, not just the Item Categories Overview report. You can find that information column in the following reports: Full orders details, Orders with items details, Revenue per Item,/Sku,/Tag and on our Pivot item Data report. You will spot Times sold column and Quantity column.
Times sold can be 1, while quantity 0.4
Latest changes:
Advanced Automatic Emailing- Choose which information to receive in email!
We are thrilled to announce that we have put this additional feature in Automatic emailings report. Now you can create reports based on information you select. Based on orders or items from orders data.
Picture is worth a thousand words, and gif file probably way more so enjoy following animation of how easy it is to select data you wish to see.
In the following example, we setup report to receive it weekly at monday for last 7 days of data. Report will show us customer name,their phone number and number of orders they made in last 7 days.
(for full view, press first mouse button on picture, to exit, click back arrow on the browser)
Cloning was ‘fixed’ so it is acutally cloning everything, not just locations/emails and times of receiving email.
Each default report now has merchantName column which will show you information for each location separately in one report. Before all location data was sumarized.
Sumarized data can now be done through Custom reports. Select measures you wish to see and do not select Merchant Name dimension.
More examples for automatic emalings are available on our FAQ PAGES.
Payments Overview report – Fetch with Extra information switch
We have added a button to fetch data with EXTRA information which triggers unwanted slowness of the report but comes with a lot of additional information.
For Example:
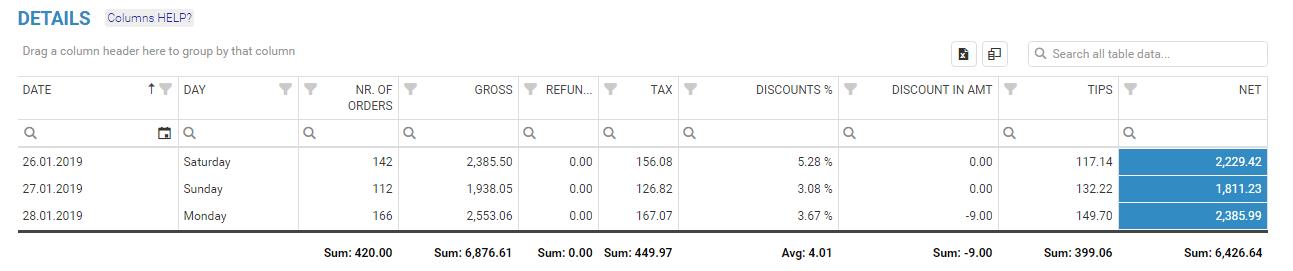
You can Analyze all payments that happened in selected period and you will get number of trx of each tender/credit card and additional columns in DETAILS table as shown in picture below:
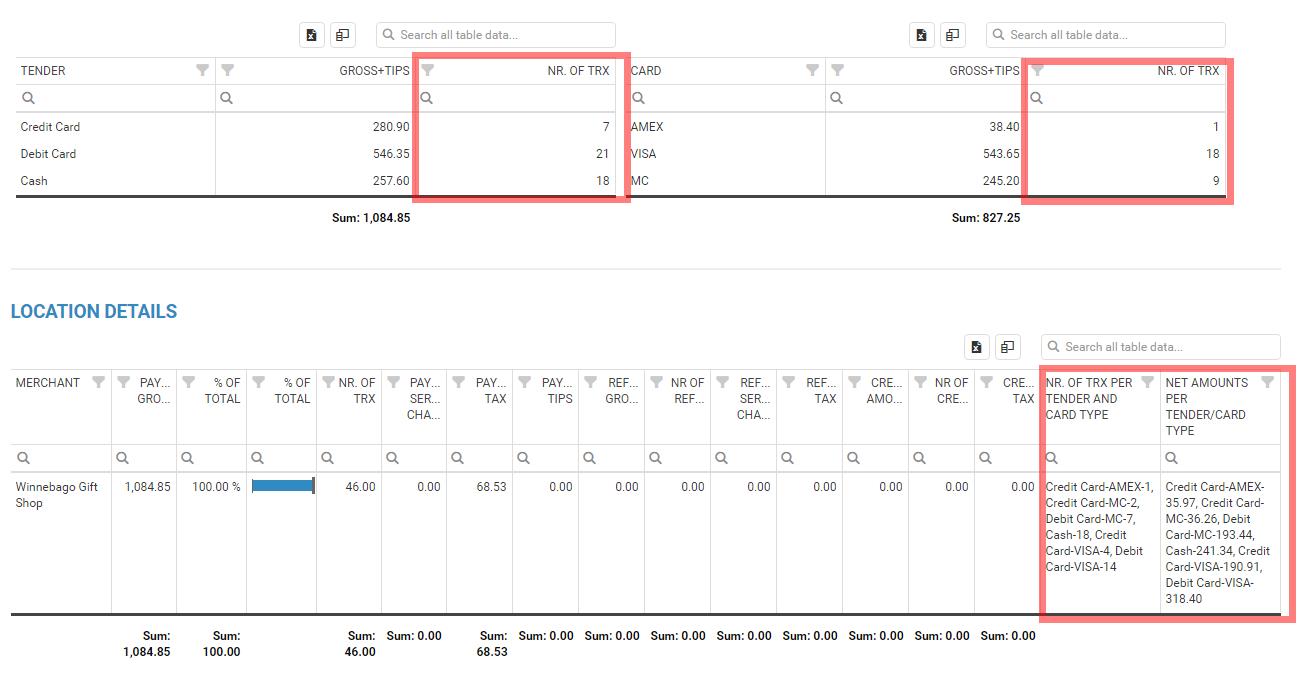
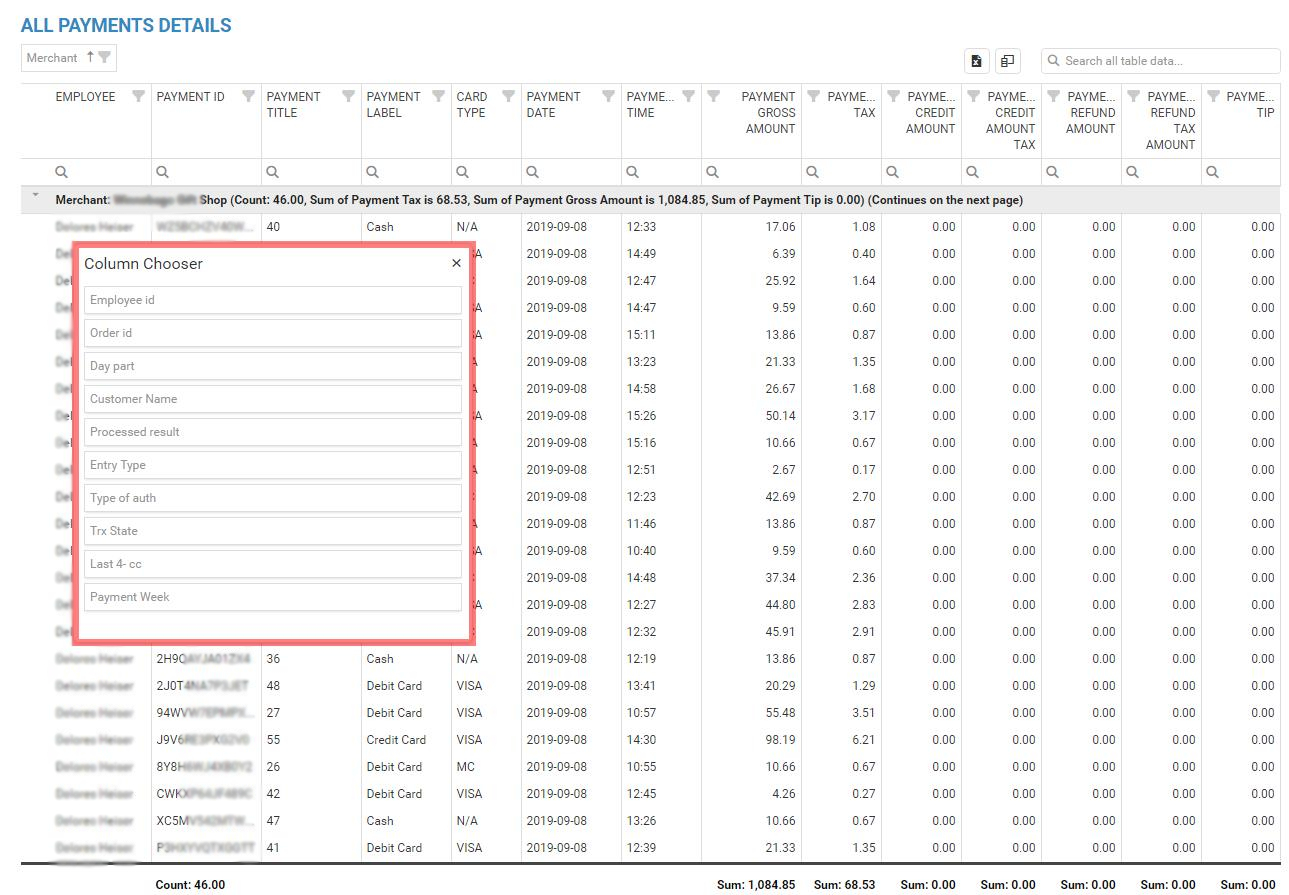
On the same page underneath Location Details table you will get additional awesome table with ALL PAYMENTS that happened in selected period and their information (and more available in column chooser), see on picture below:
By the time of publishing this article, final version of Analytics is:
19.25.1209
FURTHER PLANS:
In the near future Analytics app users can expect great performance boost, especially users with 20+ locations in our multilocation feature.
We are in process of creating a new Analytics Tier that will be based on Data Science and Machine learning which will allow us predictions and revenue forecasts and different recommendations.
Example, we would be able to predict the next 12 months of revenues with great precision, especially when data is seasonal which is very important for restaurants and hotels.
Also, we would be able to recommend bundles from the menus for the cafes and restaurants. For Example, Bundle Americano and Big brownie every Friday after 5 pm and you will see a great spike in sales. Also, we will build specialized reports that will help managers to detect potential internal frauds like when some employees are constantly giving big discounts to the same group of people – it can be suspicious.
We are opened for suggestions of what would you like to see in Analytics App in the future or what would you like us to improve
We hope that you will find these changes refreshing and if you have any questions, please do not hesitate to ask
Happy Analyzing!
Your BusinessQ | Analytics for Clover Team
Related posts


