Whether the type of business you are in, customers are your backbone. Without customers, no…
Unsold items details – because you asked for it
We always encourage you to give us feedback and suggestions on what you would like to add or change in our business apps. We love to hear from you and help your business goes smoother!
One of the things you asked for recently was more details on unsold items from your Clover devices. We realized that in order to get full view on your business, some of you had to combine several Analytics reports. After pulling them from the app, you had to merge data in excel which is time consuming and prone to human error.
Well, no more! On the ‘Category / Items / Tags Analysis’ dashboard we combined not only revenue details from items sold in selected period, but also from all other, unsold items – giving you a 360-degree overview of your item related revenues.
Do you have hundreds of some SKU item on stock and you haven’t sold any of it for past month? Do you know what is the cost of that, “dead” inventory?
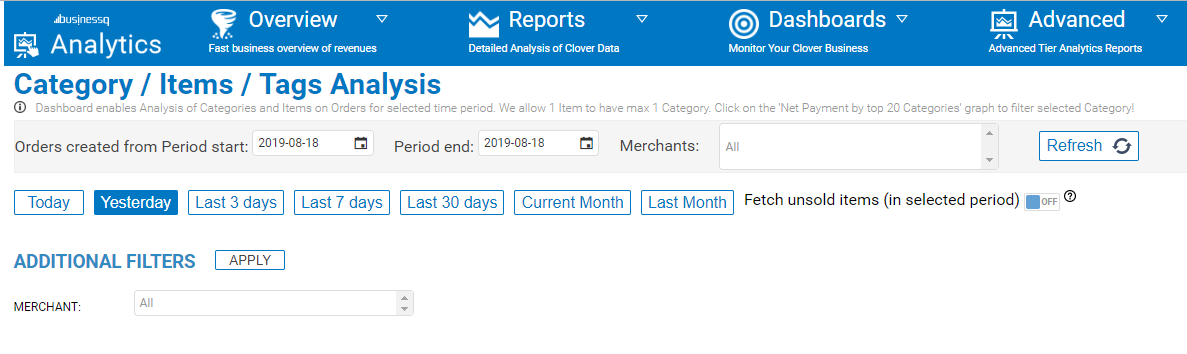
All this and more is now available in the ‘Category / Items / Tags Analysis’ dashboard:
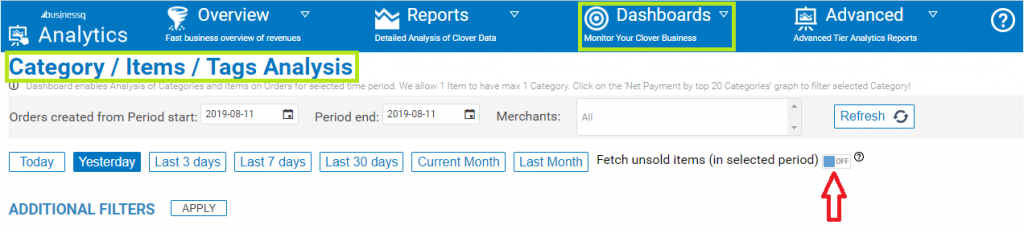
Little hint: don’t forget to turn on “Fetch unsold items” slider.
The Category / Items / Tag Analysis Dashboard is very convenient report and analysis tool. It helps you to realize what item categories or tags are the best ones or to analyse all the items in one category /tag. To realize what is your revenue per item labels/tags, and more. In a nutshell, this Dashboard will inform you on all important business aspects of your items, categories and labels/tags.
The dashboard is available from BASIC Analytics | BusinessQ app tier.
Managers and business owners will be thrilled with this tool! If you haven’t tried it yet, now it’s the time!
After all, unsold items feature was one of your ideas 😊
Have any new ideas or suggestions? Write to us!
Happy Analyzing,
Your Analytics | BusinessQ app team
Related posts


