")

Beginner’s guide to Holt-Winters Forecasting (part II)
Introduction
In the previous article, we’ve discussed what is time series data format, moving average and weighted moving average methods, and started talking about exponential smoothening. Now we will discuss advanced exponential smoothening methods, including the Holt-Winters method, and will touch upon parameters of these methods.
Double Exponential Smoothening
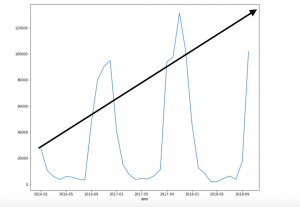
Here we have some data about monthly sales of winter assortment. If you take a closer look, you can see a trend: every year during winter, the sales grow more and more, which generally means that the shop is doing good. So, it would be reasonable to assume that this upcoming winter the sales will be even bigger because of the trend. But unfortunately, the previous method can’t catch the trend since it only depends on values from the past.
This is why in the next method, Double Exponential Smoothening, we will introduce a variable that will follow the trend and contributes to the prediction. Basically, it’s just a modified version of the single exponential smoothening that is calculated by the following formula:
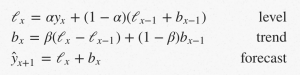
It starts being a bit clumsy, but it uses the same principle as the previous method. The biggest difference is that now we have the β variable, which is the trend factor, which works the same way as α, but for the trend component. Also, notice how the result of the first equation is now called level The prediction value is the sum of the level and trend components.
This method performs better than the previous one, but there is still something we haven’t taken into consideration. That’s why we need the next method on our list.
Triple Exponential Smoothening
The next method is called Triple Exponential Smoothening, or Holt-Winters, and it’s also based on the previous two methods. Let’s take a look at our data one more time:
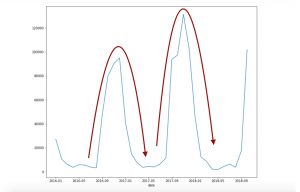
You can notice the pattern in these sales: every winter sales grow drastically, while during summer they stay low. This pattern makes sense since, as I mentioned before, these are sales of the winter assortment. However, neither of two previous methods are aware of this pattern because they are only aware of the previous values and a general trend.
That’s when the Holt-Winters method comes into play: it has all the components from the previous methods, but it also takes seasonality into consideration. Here’s the formula that determines that method:
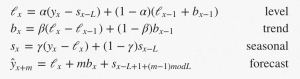
Again, it’s basically the same formula from before, but now we have the seasonal component, γ. All three components (level, trend, season) allow for pretty accurate forecasting, which makes Holt-Winters one of the strongest statistical methods for time series prediction. Also, this method can theoretically forecast as many values as we want.
There is also a certain meaning behind every parameter and a certain rule how the forecast changes with every one of them:
- Alpha – the bigger alpha is used, the more recent data is emphasized
- Beta – if the beta is high, the trend will depend more on recent points, meaning it will be more sensitive to changes
- Gamma – if gamma is high, the more recent seasonal pattern is emphasized
Citations
- Sergeyev, Dmitry. Topic 9. Part 1. Time Series Analysis in Python. www.kaggle.com/kashnitsky/topic-9-part-1-time-series-analysis-in-python.
- “Simple Moving Average (SMA).” How Mutual Funds, ETFs, and Stocks Trade – Fidelity, www.fidelity.com/learning-center/trading-investing/technical-analysis/technical-indicator-guide/sma.
- Trubetskoy, Gregory. “Gregory Trubetskoy.” Holt-Winters Forecasting for Dummies (or Developers) – Part I – Gregory Trubetskoy, 17 Feb. 2016, org/blog/2016/02/17/triple-exponential-smoothing-forecasting-part-iii/.
- Singh, Gurchetan. “Methods to Improve Time Series Forecast (Including ARIMA, Holt’s Winter).” Analytics Vidhya, 20 Sept. 2018, www.analyticsvidhya.com/blog/2018/02/time-series-forecasting-methods/.
We are developers of data visualization software BusinessQ. Try it for free and make reports and dashboards that make sense, without chart junk.
Related posts