")
Beginner’s guide to Holt-Winters Forecasting (part I)
Introduction
Today business more and more relies on data driven forecasts and prediction models. While machine learning and AI in general have gained huge popularity over the last few years, some statistical methods can still compete with more complicated algorithms. One of such methods is exponential smoothening. It is used for time series forecasting, and we will discuss it in the following article.
Time Series
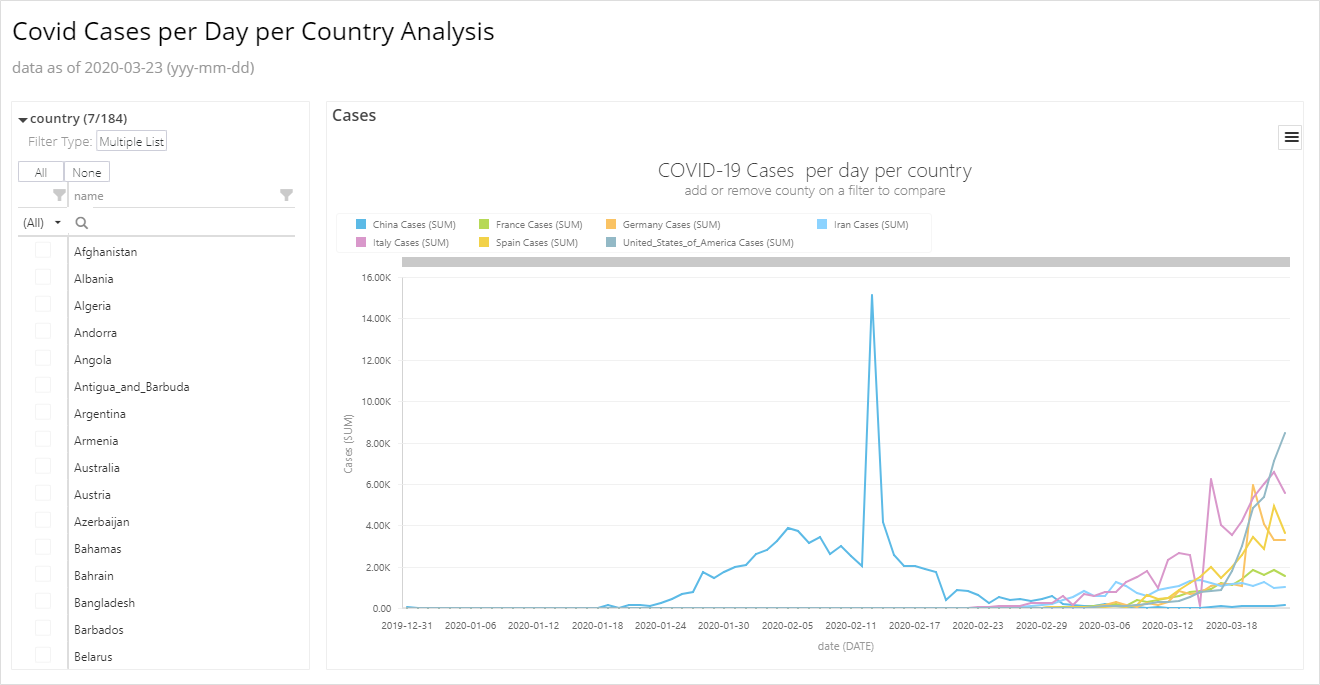
First of all, we need to introduce and discuss time series. Time series is a sequence of values of some parameter over some period of time. In other words, time series represent how some parameter has been changing over a certain timespan.
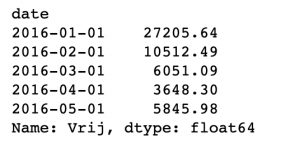
A popular example of time series would be daily/monthly sales statistics, or stock price. We simply log the value of interest every day/month, and order them by time.
For time series, the format is very important. We can think of it as a combination of time-value, and these values must be ordered by time.
Moving Average
One of the most basic technique in time series prediction is moving average. It’s a combination of two pretty naive theories: the first one is that tomorrow will be the same as today. In other words, if today our income was 5$, tomorrow we will get the same 5$, no matter what happened in the past. The other part is that we simply take an average value of our sales, assume that tomorrow we will earn that vale, and call it a day.
Moving average blends these two primitive ideas in a pretty smart way: we take the last few days or weeks, calculate the average income, and that value will be our prediction for tomorrow. And we can take any number of values at any point in time from the time series and predict the next value this way. We can also use it to predict value-by-value by sliding this “window” across the time series, that is why it’s a moving (or sometimes rolling) average.
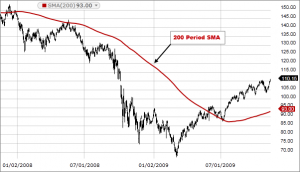
One variation of moving average that is also important to understand is weighted moving average (or WMA). It behaves in the same fashion as simple moving average, but the difference is that different values in the window contribute differently to the prediction. Usually, the older values contribute less, and the earlier contribute more.
It’s important to understand the WMA, so let’s take a look at an example. Let’s say, we want to predict the temperature for tomorrow based on the temperatures of the last 10 days. We can take an average temperature value, but what if it suddenly got really cold during the last couple of days? The simple average method wouldn’t be aware of that. But if we multiply the first day with 0.1, second with 0.2 and so on with increasing weights, these last couple of days will have a bigger impact on the prediction than those warmer ones from before.
Single Exponential Smoothening
This leads us to the first advanced method called Single Exponential Smoothening. It’s just like WMA, but instead of sliding a window across our data, we consider all the observations, but this time we exponentially lower the weights as we go back in time. So, if we have weight 0.5, the previous weight would be that value squared, or 0.25, and so on until we reach 0.
This method is expressed in the following formula:
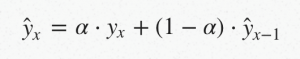
In this formula, alpha represents a weight value and is called the smoothing factor, and you can notice that this formula is recursive: (1 – α) is multiplied by previous value, which was calculated by that same formula and contains contributions of all the previous values. Basically, this method propagates forward and only depends on previous values.
In the next part of this blog post we will go further into development of Holt Winters forecasting model.
Citations
- Sergeyev, Dmitry. Topic 9. Part 1. Time Series Analysis in Python. www.kaggle.com/kashnitsky/topic-9-part-1-time-series-analysis-in-python.
- “Simple Moving Average (SMA).” How Mutual Funds, ETFs, and Stocks Trade – Fidelity, www.fidelity.com/learning-center/trading-investing/technical-analysis/technical-indicator-guide/sma.
- Trubetskoy, Gregory. “Gregory Trubetskoy.” Holt-Winters Forecasting for Dummies (or Developers) – Part I – Gregory Trubetskoy, 17 Feb. 2016, org/blog/2016/02/17/triple-exponential-smoothing-forecasting-part-iii/.
- Singh, Gurchetan. “Methods to Improve Time Series Forecast (Including ARIMA, Holt’s Winter).” Analytics Vidhya, 20 Sept. 2018, www.analyticsvidhya.com/blog/2018/02/time-series-forecasting-methods/.
We are developers of data visualization software BusinessQ. Try it for free and make reports and dashboards that make sense, without chart junk.
Related posts