Since the early days, people are faced with making decisions based on choices at the…
BusinessQ v18.0 news
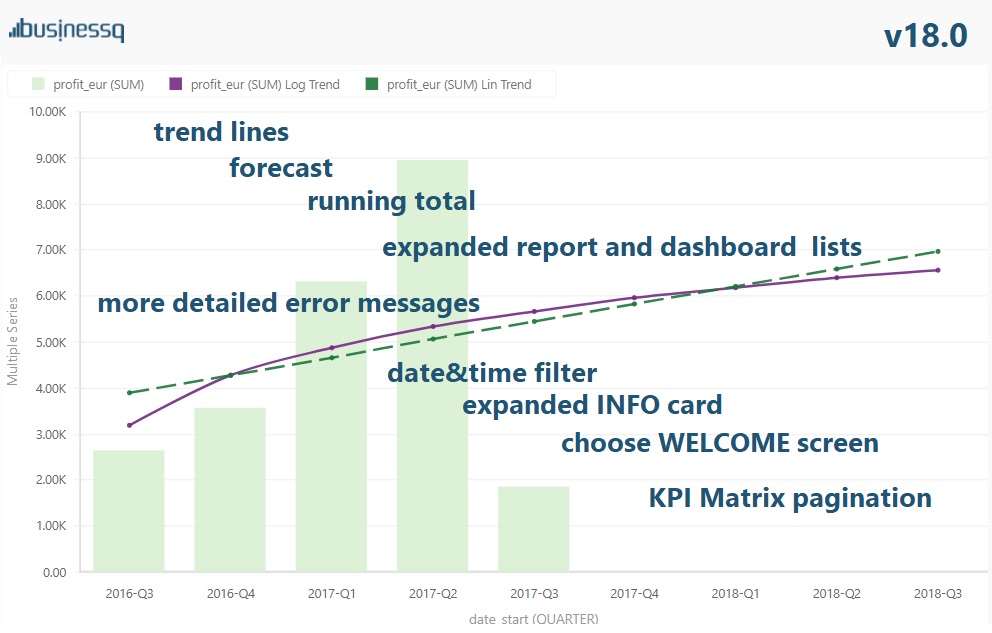
We are happy to inform you that we have published a new version of BusinessQ (v18.0).
What is new in v18.0
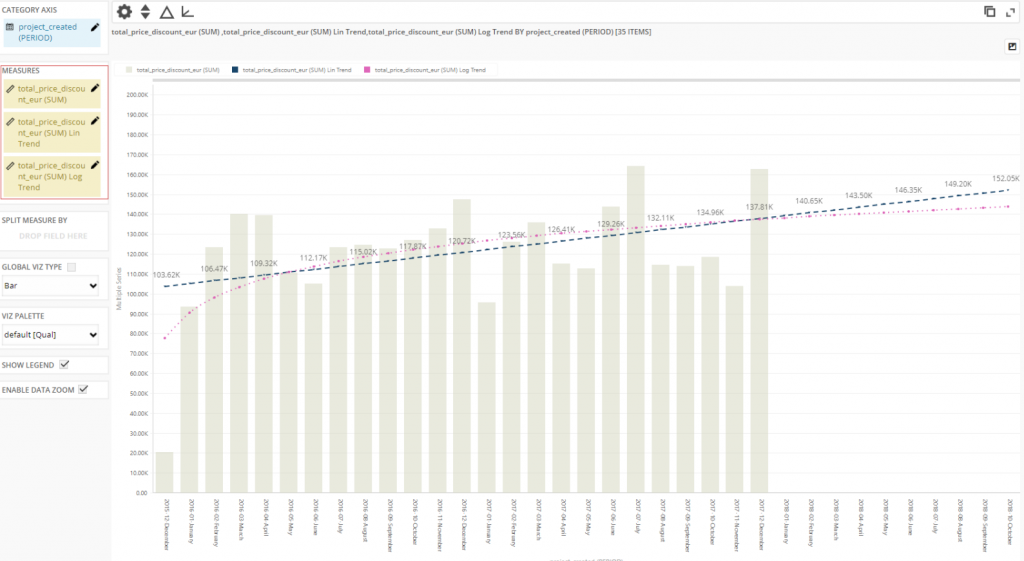
Vertical graph: trend lines fit feature added – Linear, Polynomial, Logarithmic
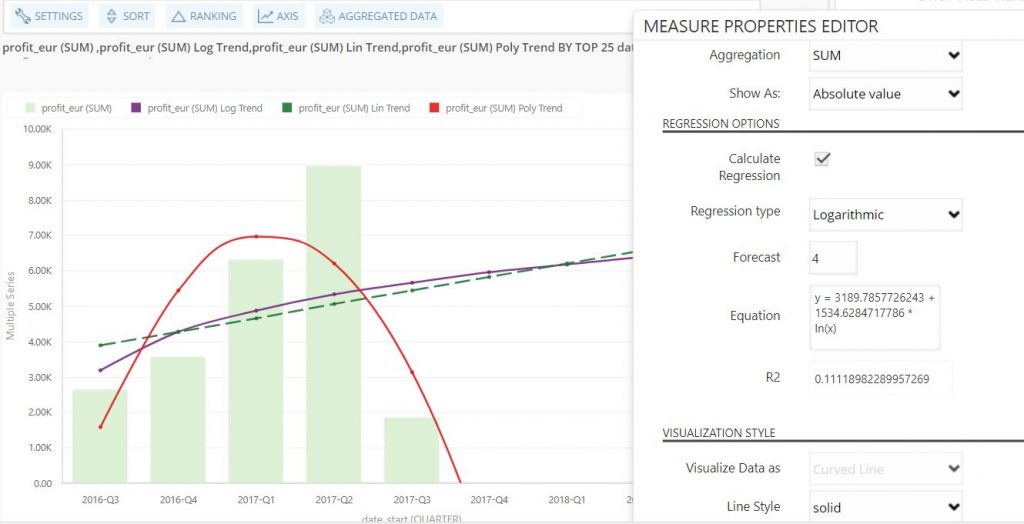
Linear trendline usually shows whether something increases or decreases at a steady rate.
A logarithmic trendline is most useful when the rate of change in the data increases or decreases quickly.
A polynomial trendline is a curved line and it is useful e.g. when you have to analyze gains and losses over big data set. Order of polynomial is determined by the number of fluctuations in the data. Order 2 polynomial trendline has one hill or valley, order 3 has one or two hills or valleys and order 4 has 3 of them.
Vertical graph: Forecast feature – you can select N periods to add to visualization and see e.g. how your future profit will look like.
Running Total (SUM, AVG, MIN, MAX) feature added in “Visualize data as”.
Report list and dashboard list are expanded with new information.
More detailed error messages on report opening.
Error handling when ‘.’ (dot) character occurred in raw data columns on TABLE viz
Date&time filter introduced in SQL query filter types. You can now filter your data not just as a date, but as a date and time.
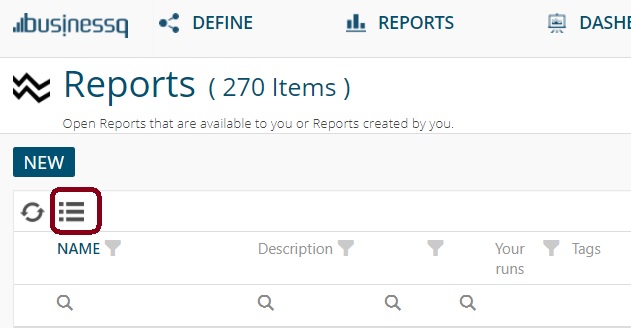
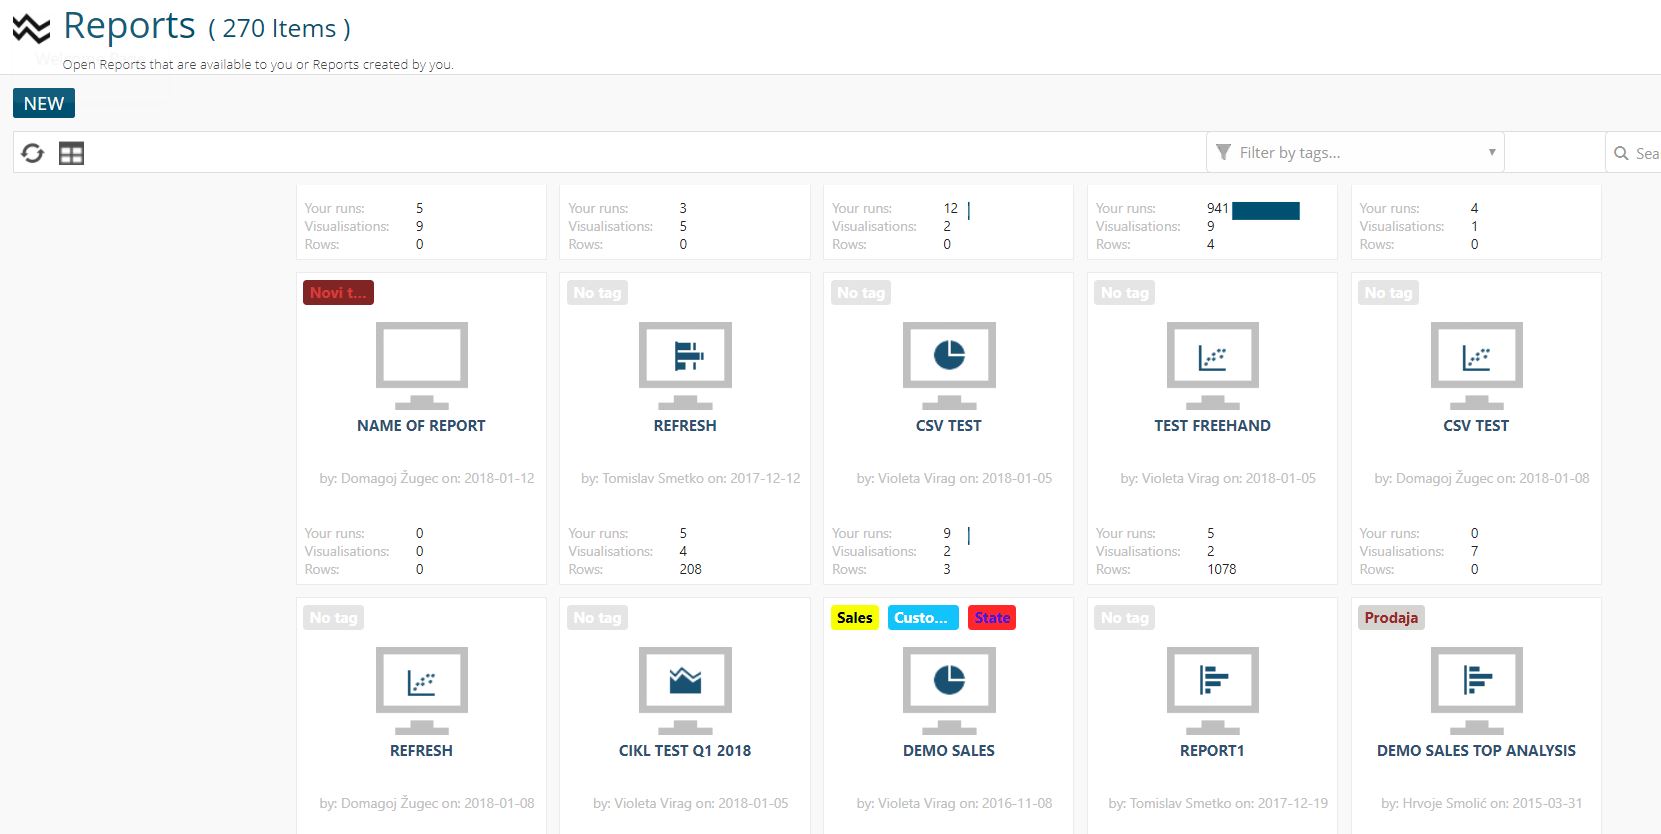
Reports, Favorite Reports, Dashboards and Dashboards Lists can be visualized in TILE view now. To switch into view mode all you have to do is click icon next to “Refresh” icon.
Report and Dashboard INFO card expanded with new information.
Also, in INFO card you can set one report or dashboard that will from now on be your welcome screen. You can’t select more than one report or dashboard for welcome screen. If you do that, BusinessQ will always use your last choice.
Pivot table – expand/collapse all button
KPI Matrix pagination enabled for faster rendering.
Various minor bug fixes and improvements.
We are developers of data visualization software BusinessQ. Try it for free and make reports and dashboards that make sense, without chart junk.
Related posts