
Whether the type of business you are in, customers are your backbone. Without customers, no…
Analytics App: version 2016-10-17 news
Greetings everyone!
Today we present you our latest version of Analytics app. This is a major Analytics app update and a lot of the exciting new features are coming with it.
To make sure you have the latest update, refresh your page with Analytics or restart your browsers. You can check your version by going to Help Page (?).

For all questions just contact us on clover@qualia.hr
MENU AND DESIGN CHANGES
The first, most noticable change, is in Analytics reports organization. In the last two years, we built a lot of new reports and now we think it is neccesary to organize them better. Therefore, we divided Analytics reports into 4 different categories: Orders, Items, Time and Diagnostics.

In category ORDERS you will find all the reports that are related to Orders, and those are:
 Orders Overview and Order Types
- Profit Overview
- Revenue per Employee
- Revenue per Payment Types
- Revenue per Device
- Revenue per Customers
- Revenue per Merchant Location
In category ITEMS you will find all the reports on Item level, and those are:
I. Revenue per Item
II. Revenue per Category
III. Revenue per Item Label/Tag
IV. Revenue per SKU
V. Modifiers Report
VI. Orders with Items Details
Category TIME groups all the reports that show data based on time and/or date periods. We have three reports in this category:

- Revenue Per Day Part
- Revenue Trends
- Revenue Per Day In a Week
Our forth and final category is something new that we present to you in this version: category DIAGNOSTICS.
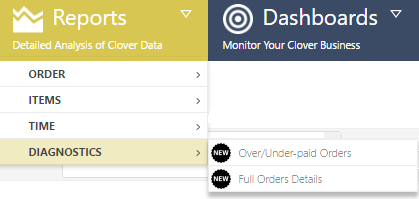
Diagnostic reports will help you to determine why you might have some differences when comparing reports that are based on Orders with reports based on Orders Items. In our development, we have came across Orders that seem to be over or under paid.
Tools that will help you diagnose irregularities on your orders are Over/Under-paid Orders and Full Orders Details reports.
NEW REPORT – Over/Under-paid Orders
Over / Under – Paid Orders report is a great diagnostics tool, capable of telling you on which orders there are discrepancies. This report is divided into two parts, one for Overpaid orders and another one for Underpaid orders.
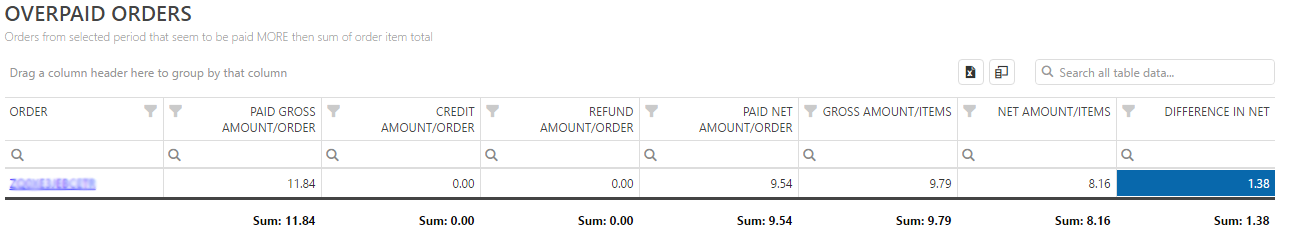
OVERPAID ORDERS TABLE
This table shows all the Orders from the selected period that seems to be paid MORE then the sum of order item total.
UNDERPAID ORDERS TABLE
This table shows all the Orders from the selected period that seems to be paid LESS then the sum of order item total.

In both tables, in column ORDER you can directly see desired order and payments for that exact order. You can see that order by clicking on the underlined order ID as shown on picture below:

By pressing order’s ID you will get complete order and payments informations for that order:

NEW REPORT – FULL ORDERS DETAILS
Our new report is highly upgraded and improved version of Orders with Items Details report, and it totals up to 54 columns. You can choose which columns you wish to see, and which one you don’t need to see. You can do that by clicking on column chooser icon ![]() , and there you can drag columns in or out of the table.
, and there you can drag columns in or out of the table.
After you have customised table in the best way that suits your needs, you can save this custom table look and every time you open this report, it will already be setup in the way you wanted it to be. If you change your mind about table appearance, you can easily save it again. You can save table configuration by clicking on the save button, positioned left to the main title ( as shown on the picture below ):

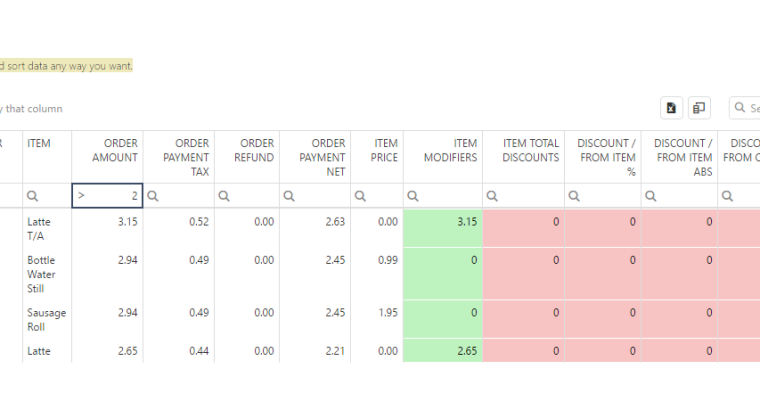
This is example of how table can look like and be ready every time I open Full Orders Details Report:

I wanted to show only orders which ID’s start with the letter ‘A’, ordered by the Time ascending where Order Amount is greater than $2. You can customize table any way you want, possibilities are limitless. For details about how to arrange table according to your preferences, you can check our Tips&Trick about our tables.
HOW TO DIAGNOSE DISCREPANCIES
Sometimes, numbers that you get in SUMMARY doesn’t match the ones you can see at the botom of your tables as totals.
Example:
In Summary I get these numbers:

But in report Revenue per Item, I get this numbers at the bottom totals:

I can see that my net number is different by almost $64. Next step I take is to open my Diagnostic Tools and find Over/Under Paid Orders for the same time period. There I can see that the difference in NET is also $64. This means that this three orders are responsible for discrepancy.

I will open last order by clicking on the underlined ORDER ID. And there I can see the following:
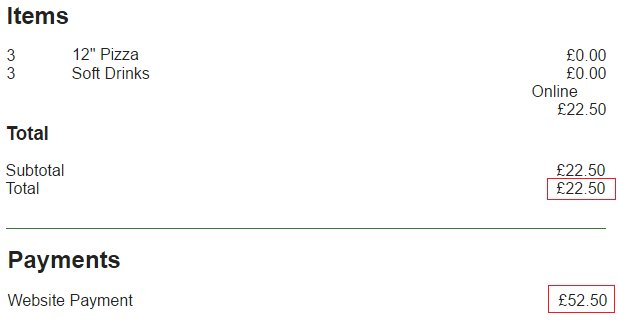
I can see that there really is difference between order amount and the payment amount, and the difference is exactly $30. What is the reason for this difference, we can’t tell for sure at this point. If you find similar examples and know the reason for discrepancies, please drop us an email.
This is just an indication that there are possible issues with the order, and you should take a closer look at orders listed in Over/Under – Paid Orders.
EXPORTING CHARTS IN DIFFERENT FORMATS
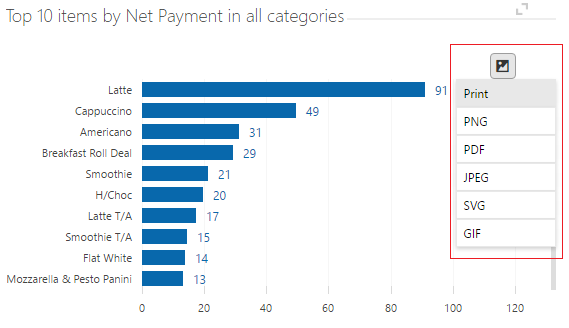
Our new feature enables you to print or export any chart in Analytics to the one of the following formats: PNG, PDF, JPEG, SVG or GIF.
Export icon ( ![]() ) can be found in the upper right corner of any chart. By clicking on it, it will show you all the formats you can export chart to:
) can be found in the upper right corner of any chart. By clicking on it, it will show you all the formats you can export chart to:
 Just one click, and you will get desired chart in any format you chose. Simple, elegant and fast solution for getting charts saved as pictures in high quality, and in the same form as you see it on our Analytics App. That means that if you zoom on chart, scroll up or down, in the export, picture will be the exactly the same ( with zooms and scrolling included ).
MERCHANT FILTERING BEFORE REFRESHING
If you are a user of multi-location feature, you will find this new filtering feature to be very useful. Up until now, we initially refreshed data for all of your merchants combined, which sometimes resulted to be long process, especially for merchants with larger number of locations. Now, we added an extra query filter for merchants. This will speed up time for getting data from Clover, since we will be only pulling data for selected merchants.
You can find mentioned filter for merchants on all of ours reports.
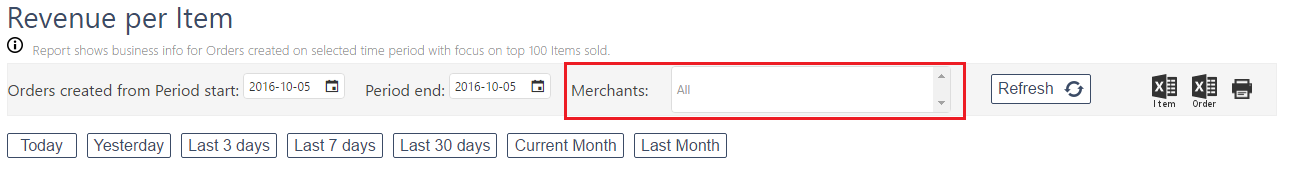
After selecting locations, you can choose dates and press Refresh button, or simply click on any of the offered time buttons (Today, Yesterday, Last 3 days..).
What is the difference between existing Additional Filters and our new filter for merchants?
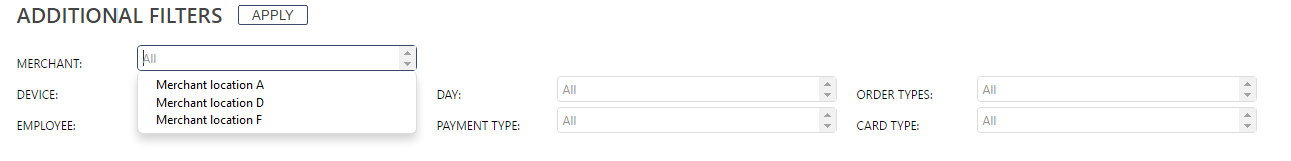
As you already know, on some reports, we have ADDITIONAL FILTERS, which enables you to filter data by merchant, device, employee, day, payment type, card type, etc.

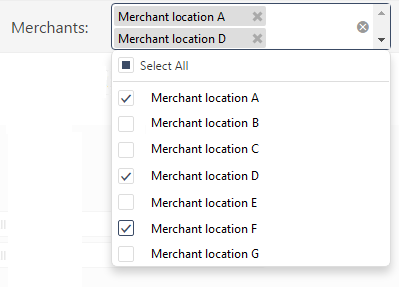
Main difference between our two filters is that Additional Filters only filter data you already pulled from Clover, and our new merchant filter selects which data will be received from Clover in the first place. Therefore, in our new filter you will get the list of all your merchants, and after period selection, in additional filters merchant’s field you will get only those merchants that you selected in new filter (because for other merchants we didn’t pull anything from Clover). Note that in Additional Filters you won’t see locations for which there aren’t orders in the selected time period.
So, in our example, I selected Merchant locations A, D and F. After clicking on Refresh button, my Additional Filters will look like this:
This means that we had less data to get, which results in faster loading of reports.
TIME BUTTONS ADDED ON OVERVIEW REPORTS
We added time buttons ( Today, Yesterday, Last 3 days, etc) to Overview reports: Payments Overview, Employee Overview and Item Categories Overview.

We are at your disposal for any questions, so don’t hesitate to contact us at clover@qualia.hr.
We hope you will find this new features useful.
Happy Analyzing!
Your Analytics for Clover Team
Related posts


