Whether the type of business you are in, customers are your backbone. Without customers, no…
Analytics App: version 2016-11-30 news
Hello everybody!
Today I would like to present the latest version of Analytics app. There are several new features in this update, so make sure you have the latest version of Analytics app.
You can check your version by going to Help Page (?).

If you don’t see the latest version, refresh your page with Analytics or restart your browser.
For all questions just contact us on clover@qualia.hr
NEW REPORT – TODAY AT A GLANCE
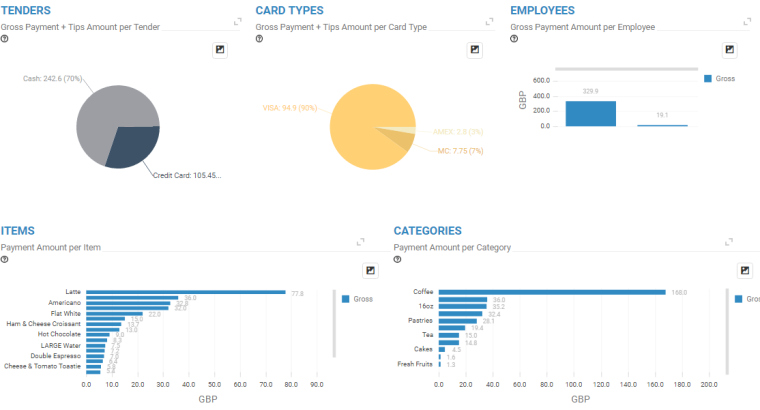
Our traditional Welcome page is now upgraded with new report– TODAY AT A GLANCE report. Now, every time you login to Analytics, you will be presented with today’s data about most important aspects of your business including comparisons with the same day last week and the same day last year, todays payments per tenders, card types, employees, items, categories and details per merchant locations.

When you wish to refresh data, you can do this by clicking on TODAY AT A GLANCE tab.

Our traditional Welcome page is still available and can be accessed by clicking on WELCOME PAGE tab.

COMPARISONS
By comparing data from today, from the same day last week and the same day last year, you will see how your business advances or regresses over the time.
Data shown for all the dates separately is net revenue, number of payments and average payment amount. After this information, we will compare net revenue from today’s date with other two dates.

* Please note that the same day last year is not the same date as today. Same day last year is the closest day last year that falls on the same day in the week as today. For example, if today is Saturday, same day last year will also be Saturday even if it doesn’t fall on the same date as today.
CHARTS
TODAY AT A GLANCE report comes with two pie charts (for Tenders and Card Types), one vertical bar chart (for Employees), two horizontal bar charts (for Items and Categories) and one table (for Locations details).

Above mentioned charts will help you to visually interpret data that is crucial for making business decisions.
ALTERNATE NAME COLUMN
Alternate name column is now available in Revenue per Item Report. You can enable this column by clicking on Column Chooser icon and simply drag that column anywhere in the table.

NEW TABLE – ITEMS NOT ON STOCK
Stock Value Dashboard is now improved with the table that shows you all the items that you don’t have on stock (all items which Stock Count is less than 1. This is very useful information to quickly see which items are missing on stock and need to be filled up again.
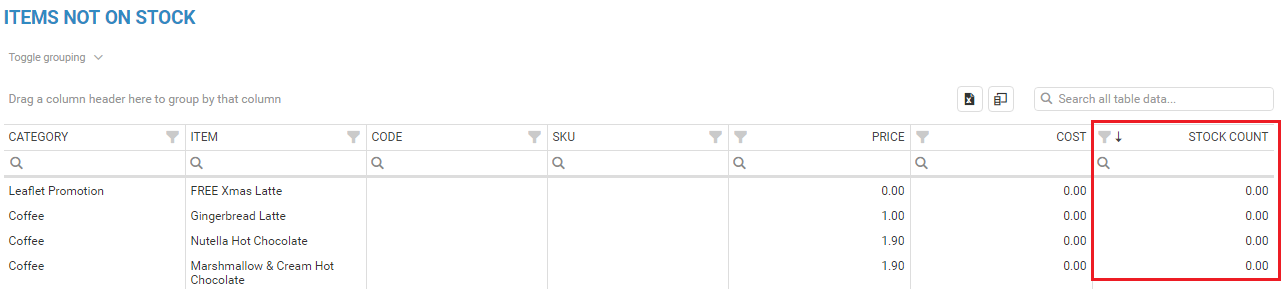
You can find this table in our Stock Value Dashboard:

TOGGLE GROUPING
On all bigger tables in Analytics, we added a simple Toggle Grouping arrow that will allow you to group/ungroup all table data at once.
![]()
This comes in handy when you are grouping data and you don’t want to close/open grouping data one by one. Toggle Grouping option is positioned below table’s title on all bigger tables.

At the picture below, you can see the how the same table looks like when I press on the Toggle grouping:

We are at your disposal for any questions, so don’t hesitate to contact us at clover@qualia.hr.
We hope you will find this new features useful.
Happy Analyzing!
Your Analytics for Clover Team
Related posts


