Whether the type of business you are in, customers are your backbone. Without customers, no…
Analytics App: Favourites and How-To Tabs
Hello,
We are happy to enter the New Year with new features – like ability to choose your favourite reports and dashboards in Favourites Tab. Also, now there is a new How-to tab with questions and answers about Analytics capabilities.
We are aware that since each of you have your own type of business ( from restaurants, retailers, cafe bars, shops, etc ..), you will focus on its different aspects and therefore different Analytics reports.
Considering this, you will certainly like our new feature – Favourites.
FAVOURITES DASHBOARD
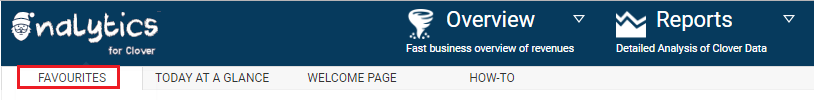
As soon as you login to Analytics new version, you will notice new favourites tab. You can use it to choose reports and dashboards that you use most frequently. From now on, each time you enter Analytics, you will be able to open your favourite report with just one click. We are sure that this will make getting insights from our app even faster.
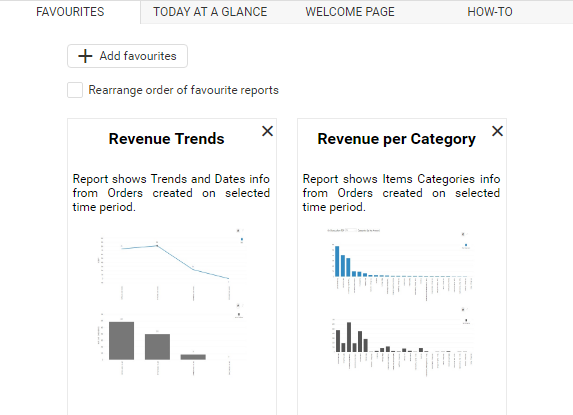
You will find Favourites Dashboard immediately when you login to Analytics:
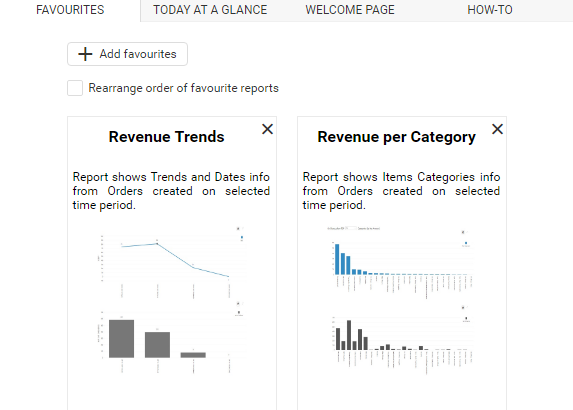
First time you open Favourites, two reports will already wait for you by default (Revenue Trends and Revenue per Category):
To add new reports to your Favourite list, you should press +Add favourites button positioned at the top of the Favourites Dashboard:

Once you clicked on the Add favourites button, you will get a list of all reports, overviews and dashboards that we have in the Analytics app. You can simply check/uncheck which report you wish to see on Favourites Dashboard:
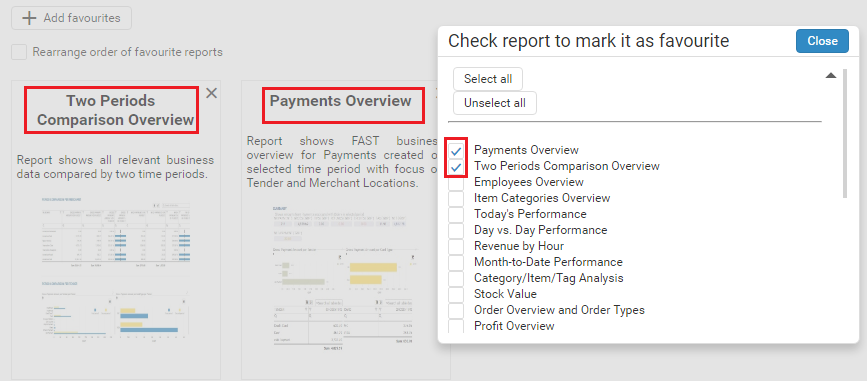
Also, you can use buttons ‘Select all’ and ‘Unselect all’ for faster selection:

If you wish to remove report from Favourites, you can do that by unchecking that report when you click at Add favourites button, or you can directly press on the X button, at the top right corner of every Favourite report:

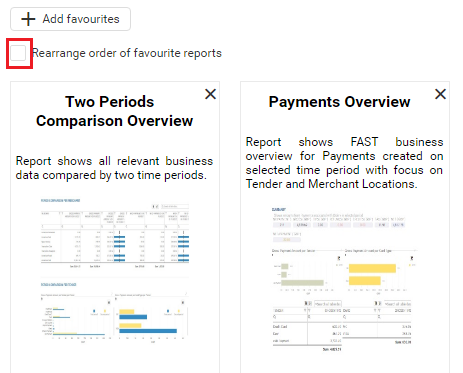
You also have the ability to rearrange the order of the report in your Favourite Dashboard. You can enable rearranging process by clicking on the box ‘Rearrange order of favourite reports’:
As soon as you click on the Rearrange box, you will notice arrows above reports:

Simply press < arrow if you want to move report one place to the left, and > arrow to move report once place to the right.
HOW-TO TAB
‘How to tab’ is fast source of information which will help you to select the best report/dashboard for specific business need.
You can find How-to tab here:

When you click on the How-to Tab, you will get a list of question and answers that will help you to
- decide what report will show you which information in the most appropriate way for you,
- know your way around Analytics app
- understand how to do certain things like exports and filtering in Analytics:
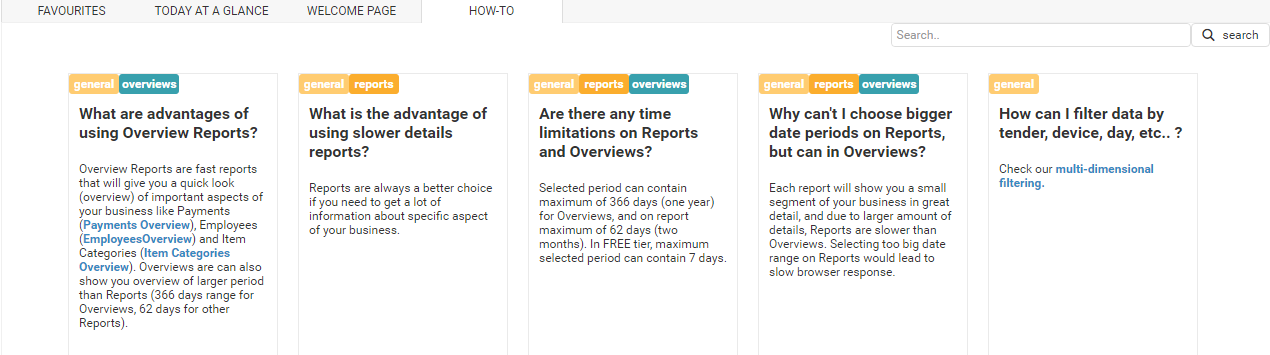
You can expand every question by simply clicking anywhere on the question box:

At the top of the every question, you will find all the categories the question is related to:

This categories will help you navigate though questions with more ease.
You also have the ability to seach through questions with the help of Search field which can be found at the top right corner of the How-to tab:
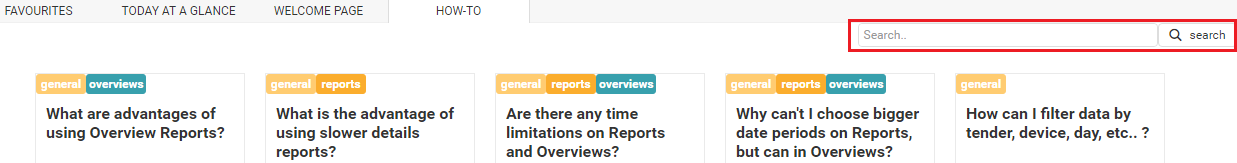
If I want to find all the questions regarding Dashboards, I will simply enter ‘dashboards’ in the search filed and press Search button:

We are confident that this will give you better insight into what Analytics can do for you and into all the possibilities Analytics have that you probably didn’t know about.
You can always contact us at clover@qualia.hr for any questions.
We hope you will find this new features useful.
Happy holiday season!
Your Analytics for Clover Team
Related posts


