Whether the type of business you are in, customers are your backbone. Without customers, no…
Analytics Tips&Tricks: Tables
Hello everybody,
Today I will show you some of the cool features our tables in the Analytics App have.
GROUPING
At the top of amost each table, you can find text: “Drag a column header here to group by that column”.

Any column you drag there will result in grouping by that column. For example, if I want to group my table by column Merchant, first I click on table header and then I drag it there.
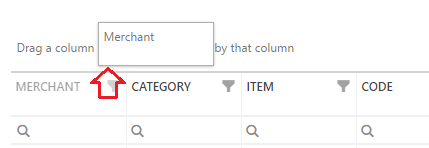
After draging, instead of text ‘Drag a column header here to group by that column’, you should see the name of the column you chosed.
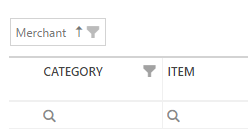
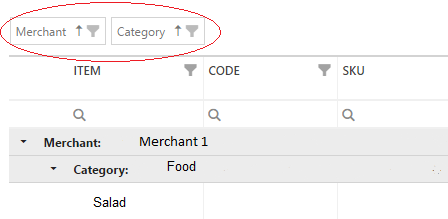
Instantly, you will see all data grouped by chosen column. Also, it has enabled multi-column grouping. For example, you can drag both merchant and category columns, and you will get data sorted by merchants, by categories.
EXPORT TO EXCEL
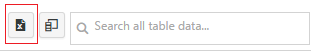
At the right side of the table header, you can find Excel icon.
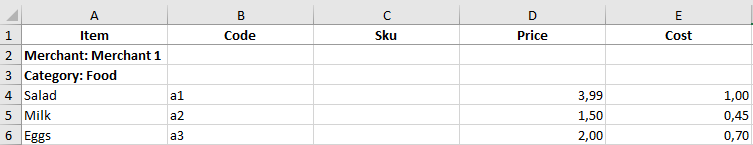
It enables you to export all your table data to the excel in exactly the same format that you currently have over your table (for example, if you grouped data by category, then export in excel will also be grouped by category).
Excel export will look like picture below:
COLUMN CHOOSER
This icon is also located at the right side of the table header, right next to the excel export icon.
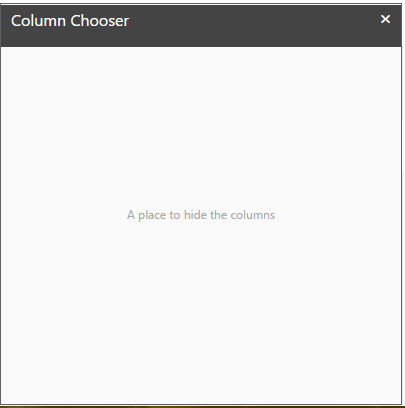
![]()
When clicking on it, a box will appear and in it you can drag-in all columns you don’t want to see, or drag-out if you wish to see them again.
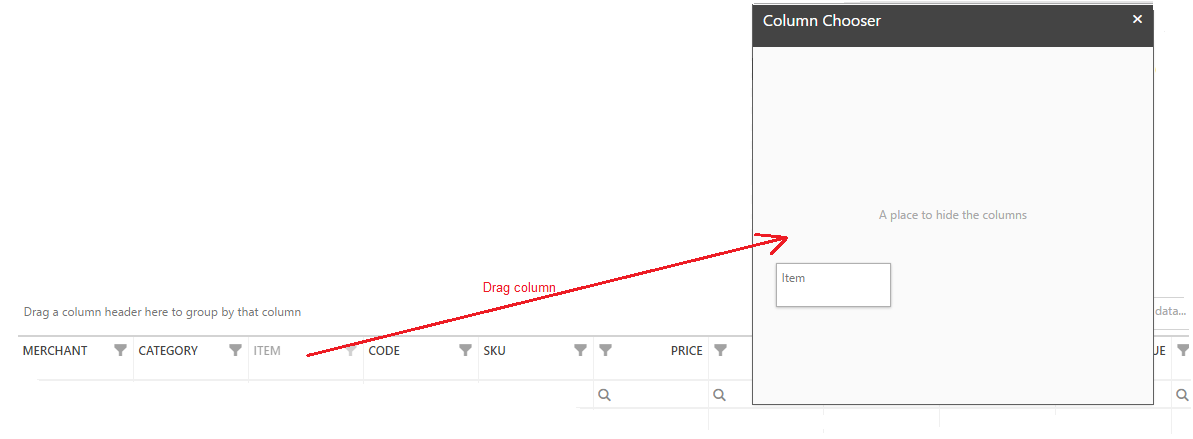
In column chooser, you can put as many columns as you wish.

It comes very handy if you don’t want too many columns to show, especially for those columns that are very similar. If you change your mind, and now wish to see columns you earlier hid, you simply drag those columns back on the table.
SEARCH ALL TABLE DATA
Positioned next to Excel export and column chooser icon, “Search all table data…” is available.
![]()
In this search area, you can type text or numbers, which you wish to find in all table columns. After pressing Enter button (or simply by waiting for few seconds) you will see only rows that contain the text/number you entered in search field. It will find the result no matter in which column it is (it searches all table columns).

In above shown example, you can see that number 4.99 is found in more then one column, that is, both PRICE and PRICE VALUE columns. It will not show you rows which do not contain the text/number specified in Search field. If you want to see all your data, you can simply delete entry from Search field.
SEARCH COLUMN
Instead of searching the whole table, it is also possible to search in just one column. Under column name there is a little magnifier icon.

By enterning text or numbers in this area, you will get only rows which in that column have specified text.

It is allowed to search by more then one column. For example, you can search all items which have stock count 6, and their price is 3,50.

One of the best features our tables have is that you have the possibility to customize your own searching criteria. By clicking on magnifier icon, or by hovering over, you will get a menu. Numeric and text menu have differences.
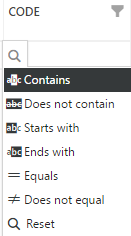 -> for text fields for numbers <-
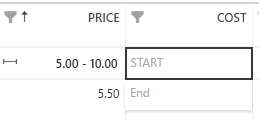
Table can also have more than one of this custom searches. For example, I want all items that have Price between 5 and 10$, and their stock count has to be greater than 7. For this, first I have to click on magnifier icon under Price and click on ‘Between’, then it offers me to enter START and END numbers (I chose 5 and 10).
Second, I want stock count for items to be greater than 7. I click on magnifier icon under Stock count, and I select ‘ > Greater than’, and I enter number 7. My results are shown in the table below.
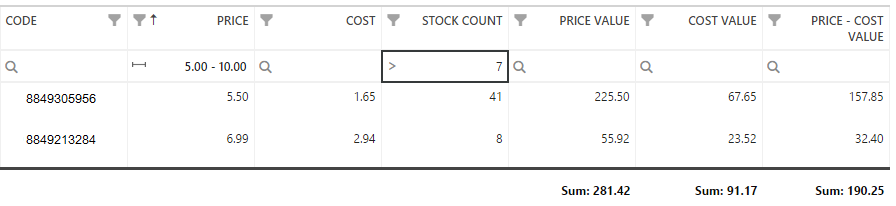
If you no longer wish to apply your custom search, you click again on magnifier icon and select Reset. And now, you once again have all table rows shown.
COLUMN SORTING
Every column has option to sort table data by that column, both ascending and descending. By simply clicking on column name, you table will be sorted ascending.

By clicking on the same column name, table will be sorted by that same column again, but this time sorting will be descending.

Tables can be sorted by any column of your choosing. All you have to do is to click once on column name.
FILTERS
Just like all columns can be sorted, grouped or searched, they all have one more feature: Filter. Above magnifier icon, there is a funnel icon. ![]()
Once you click on filter icon, you will get listed all options you have in your table.
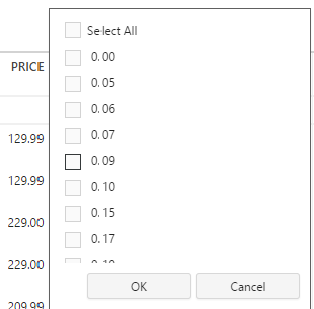
For example, I want to filter my table data so that only items where cost is 0.10, 0.15 or 0.24 show. For that to happen, first, I have to check those numbers.

After checking values, I simply have to press ok button to get my filtered table. As we can see on picture below, in our COST column we can find only those values that we chose in step before.
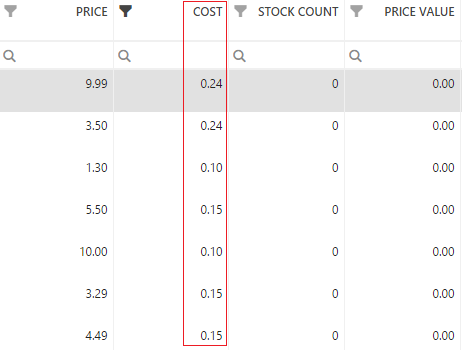
TABLE TRANSFORMATIONS
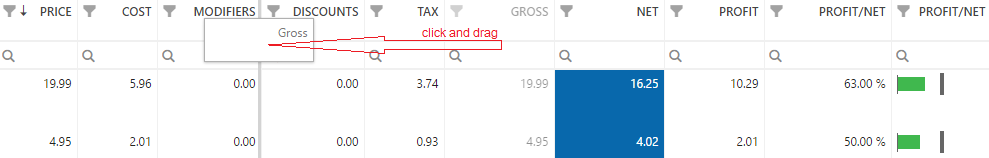
1. Column reordering: Every column can be moved and positioned in another location. Example, I have table like the one on the picture below.

Now, I want column GROSS and DISCOUNTS to switch positions. For that, I have to click and drag column GROSS, and place it between Modifiers and Discounts.
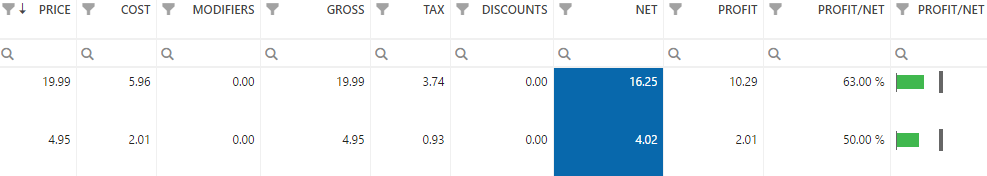
Now lets move to Discounts column. Click and drag Discounts between Tax and Net.

And voila, we switched positions of Gross and Discount columns. Result can be seen on picture below.
2. Custom column width: If you need some columns to be bigger, or some are too big and need to be smaller, you can easily change that. Between columns, there is a line. By hovering over that line, you will see a symbol like <-||->. To see that symbol, you need to hover over lines in table header (where column names are positioned).
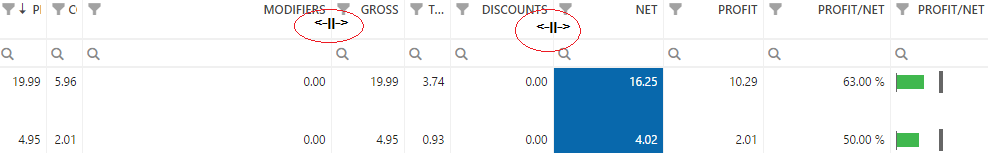
In table above, fields Price, Cost and Tax are almost invisible, but column Modifiers is too big. By pulling column lines, you can decide how big or small each column will be. Mine is shown on picture below.

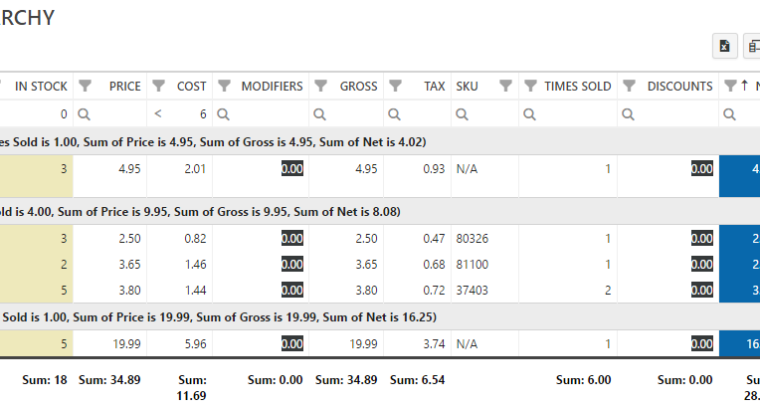
CONCLUSION
Different data manipulations in tables we have in Analytics app can be very powerful tools in analyzing. Best thing is, those features can be combined together. For example I will group table by Category, I will put Price Value and Cost Value into Column Chooser, where In Stock ‘Does not equal’ 0 and Cost is ‘Less than’ 6$. I will order results ascending by Net column. And finally, I will Search all table data for value 0,00.
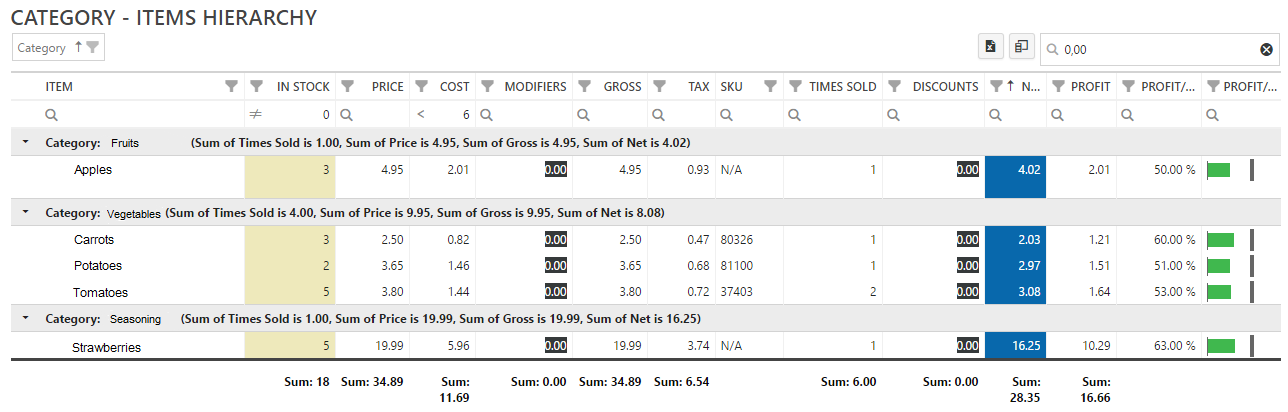
This is how my table looks like after using all mentioned features.
For any questions and comments, contact us on clover@qualia.hr.
Have fun using these features and happy Analyzing!
Related posts


