Whether the type of business you are in, customers are your backbone. Without customers, no…
Improved Item Categories Overview
Greetings!
Today, I will show you some new features in our Item Categories Overview in Analytics app.
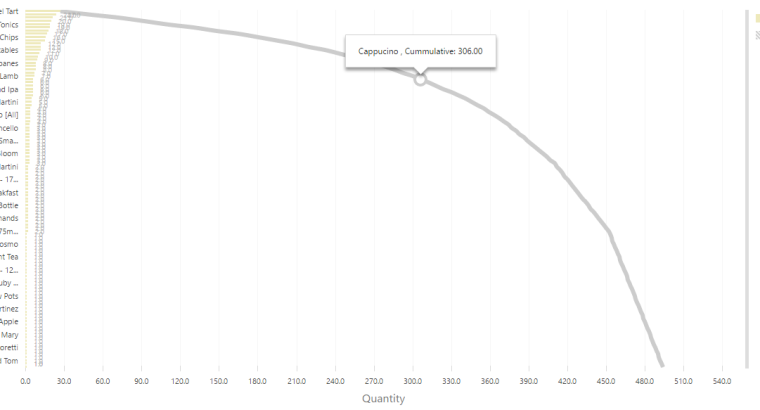
In addition to existing charts, we added another two charts which represent top performance items. This charts are meant to show which items make 80% of your total revenue or items that make 80% of your total number of items sold. Also, new feature in this charts are Cummulative lines.
For example, in the following chart you can easily see that revenue amount is well dispersed among the items sold – 110 items out of 139 items in total contribute to 80% of the revenue. Further, you can see that about first 10 items are the major revenue source.

Cummulative lines
These cumulative lines are based on Pareto Analysis which shows which items have the greatest influence on your revenue and which ones will have the least amount of impact on your revenue. Pareto analysis is also known as 80/20 rule, and it is based on the idea that 80% of world’s wealth belonged to only 20% of population. This idea can also be applied in the world of business, where, for example, 80% of your revenue can come from 20% of your items. This way you can clearly see which items have the biggest influence on your revenue.
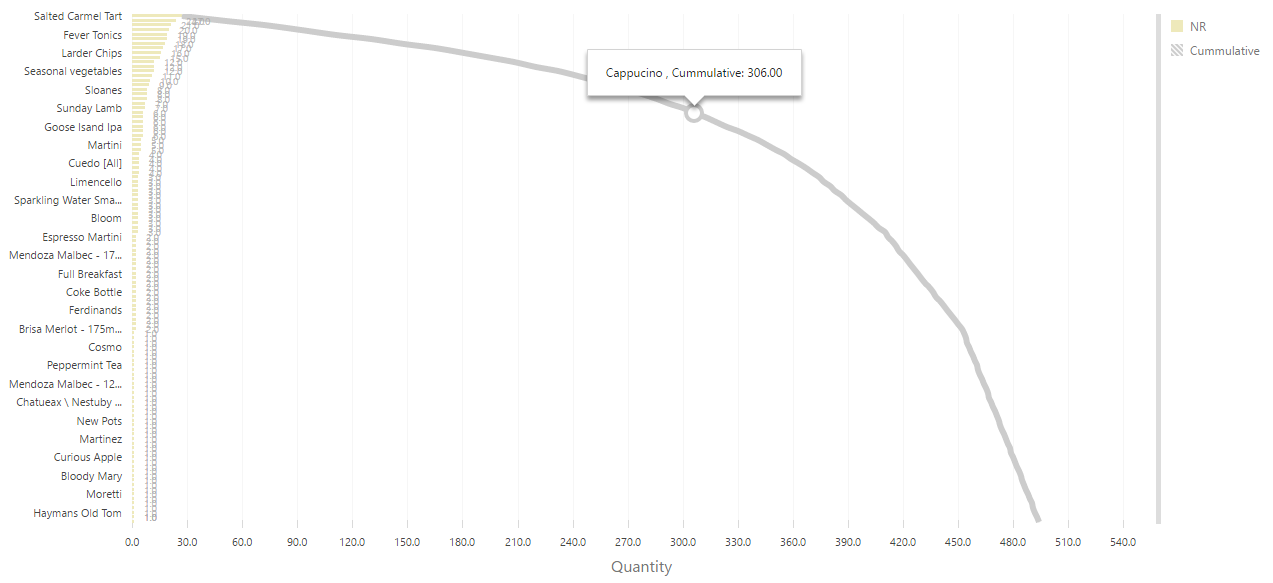
In the above example, you can see that first 20 items were sold more then all the others combined ( 306 vs 500 in total ).
Table – Unsold Items
Below detailed table which lists all items that were sold in selected period, we added another table. This table shows all items that haven’t been sold in the selected period, with details about those items. This table is meant to help you identify which items weren’t so popular in the selected period, so you can take actions based on that intelligence – especially if you have many of unsold, “unpopular” items on stock.

In title of table SOLD ITEMS, we added number of items that were sold in comparison with total number of items on stock. Also, we added number of unsold items in table UNSOLD ITEMS.

We hope you will find this improvements useful.
For any questions, contact us on support@qualia.hr.
Happy Analyzing!
Your Analytics for Clover Team
Related posts


