Whether the type of business you are in, customers are your backbone. Without customers, no…
Analytics Revenue by Hour
Revenue by Hour Dashboard
Today we want to present all the features of Revenue by Hour Dashboard in our Analytics for Clover App.
This Dashboard is available from the BASIC App Tier.

You can open it via Dashboards menu:

By default, you will see your data from TODAY. You can select custom date filter range on period start / end fields, and press Refresh to get the data:

Maximum allowed period range for BASIC Tier is 90 days, while for FREE Tier it is 7 days.
Alternatively, you can click on one of our predefined date range filters:

Revenue by Hour Dashboard is great when you need answers on questions like
- What is my Revenue and number of orders per Hour in a day for custom date range?
- What do I sell in what part of day?
- Can I close my shop earlier (because I don’t do any significant revenue later in a day)?
- When can I expect the most orders in a Day, when is the peak?
- For every Hour I want to see Revenue by Item Tag.
- For every Hour I want to see Revenue by Order Type
- What order type do people buy in what part of the day?
- …
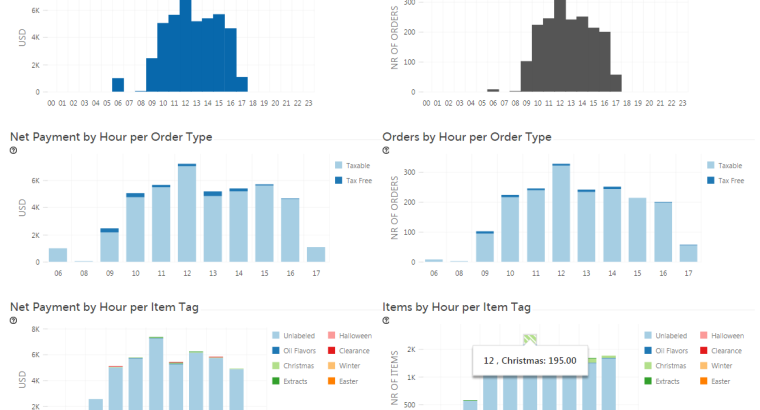
In the first part of the Dashboard you can find a Summary for selected period, with graphical distribution of Net Payment and Number of orders by hour, for selected date period:

Following is Net payment and Nr. of Orders by Hour, but sliced for every Order Type:

Below you will find Net payment and Nr. of Orders by Hour, but sliced for every Item Tag:

Finally, all the details by Hour are presented in table: 
As a conclusion, Revenue by Hour Dashboard is a powerful tool for monitor your Net payments and Number of orders for custom date range by Hour.
If you are looking for place to get started, check out our Analytics webpages.
If you have any questions about how to use Analytics, just contact us .
We are dedicated to offering you amazing support and we’re happy to help you get started.
Thanks,
Your Analytics for Clover Team


