COOL VISUALIZATIONS – need or disturbance in modern business?!
Part 1. – Radar Charts
Radar charts, also known as spider, web charts seems to be more and more popular in today’s visualizations. Many well-known BI tools providers have those kinds of charts in their data visualization portfolio.
But do they really support decision makers to make the best decisions in a short time? Are they limiting factor in making quick and precise business decisions?
Spider charts are two-dimensional charts. They are “designed to plot one or more series of values over multiple common quantitative variables by providing an axis for each variable, arranged radially as equiangular spokes around a central point.”[1] As it is maybe hard to imagine, it would be better to visualize:
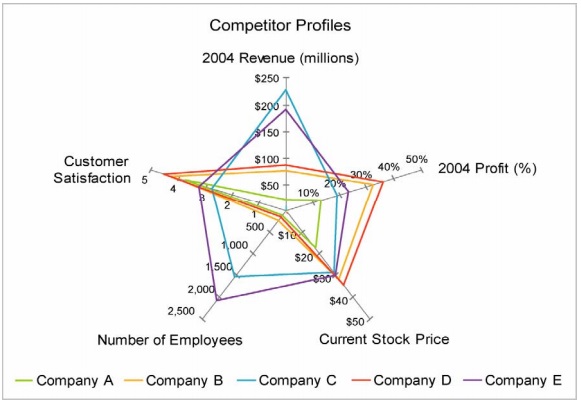
Picture 1: Radar chart visualization[2]
Picture 1 shows one of many ways of showing data with radar chart. This artificial radar chart shows independent axis scales.
As it can be seen, the chart does look good, multicolor, maybe a little bit futuristic. It does look like it provides a great range of information to the user, it looks sophisticated. But when it comes to making a decision, does it provide the user with clearly readable and noticeable information, as it is the main point of data visualization? With one word – NO. There are a lot better options to visualize almost all kinds of information so decision makers can have better insight into critical data.
As there is no rule without exception, there needs to be mention that there are some cases when radar charts are a good option. For example, when there needs to be presented continuous flows, radar chart can be the right choice.
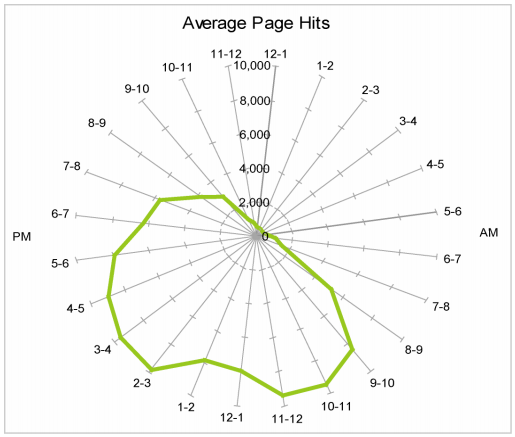
Picture 2: Radar chart visualization of continuous flow[3]
Radar chart, when presenting a 24 – hours clock is good to visualize the continuous nature of time. There is no disconnection between the ending of one hour and the start of another.
To conclude: As for anything that exists, radar charts cannot be considered either bad or good. There are situations when radar charts are good to visualize data. This kind of chart needs to be reconsidered when the user has some specific information which needs to be presented as a continuous flow.
However, those situations when using radar charts is justified, are rare. There are much more occasions when radar charts are used in the wrong environment. The wrong chart represents disturbance when prompt and correct business information and decisions are needed. For the vast majority of information, radar charts are not a good choice; “they are unable to efficiently and effectively communicate information to the user.”[4] While picking the right chart, one has to pay attention to visualize data in the simplest and noticeable way.
In order to provide our users with the best visualization solutions for their business, BusinessQ only supports charts which are the most appropriate for business data visualization.
We are developers of data visualization software BusinessQ. Try it for free and make reports and dashboards that make sense, without chart junk.
[1] Odds, G. (2011) A Critique of Radar Charts, Scott Logic Blog, [blog post, Sept. 23, 2011]. URL: https://blog.scottlogic.com/2011/09/23/a-critique-of-radar-charts.html [accessed: Nov. 28, 2018]
[2] Few, S. (2005): Keep Radar Graphs Below the Radar – Far below, Perceptual edge Article, [May 2005]. URL: https://www.perceptualedge.com/articles/dmreview/radar_graphs.pdf [accessed: Nov. 28, 2018]
[3] Few, S. (2005): Keep Radar Graphs Below the Radar – Far below, Perceptual edge Article, [May 2005]. URL: https://www.perceptualedge.com/articles/dmreview/radar_graphs.pdf [accessed: Nov. 28, 2018]
[4] Odds, G. (2011) A Critique of Radar Charts, Scott Logic Blog, [blog post, Sept. 23, 2011]. URL: https://blog.scottlogic.com/2011/09/23/a-critique-of-radar-charts.html [accessed: Nov. 28, 2018]
Related posts