Whether the type of business you are in, customers are your backbone. Without customers, no…
Analytics App – Employees reports
Hi, everyone!
In today’s blog entry for our Analytics App for Clover, we are explaining how to get valuable information concerning your employees using Employees Overview and Revenue per Employee reports. Those reports are a privilege of the BASIC and ADVANCED tier.
- EMPLOYEES OVERVIEW REPORT
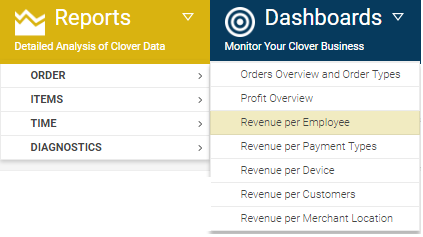
So let’s start with Employees Overview report which you can access from the menu like shown in the picture below:
Report facts:
- Report is based on payments
- Very Fast Report
- Period selection up to 1 year
- Less details
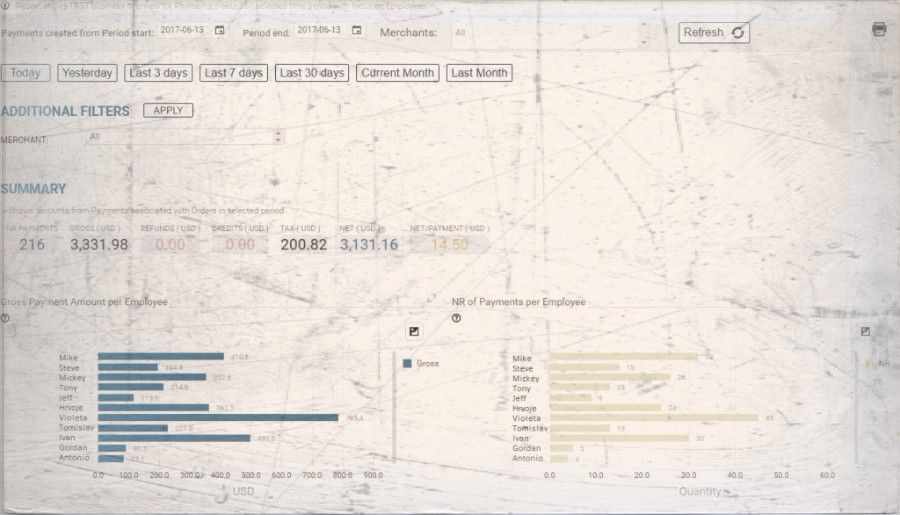
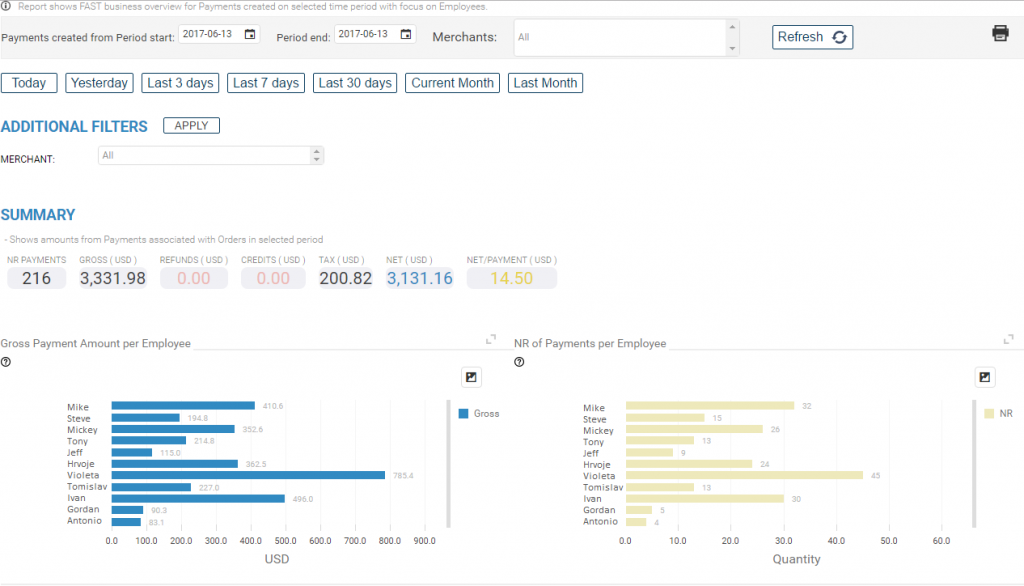
Similar to Payments overview report which is all about payments, this one is all about your employees, allowing you to find out everything about your employees in the selected time period.
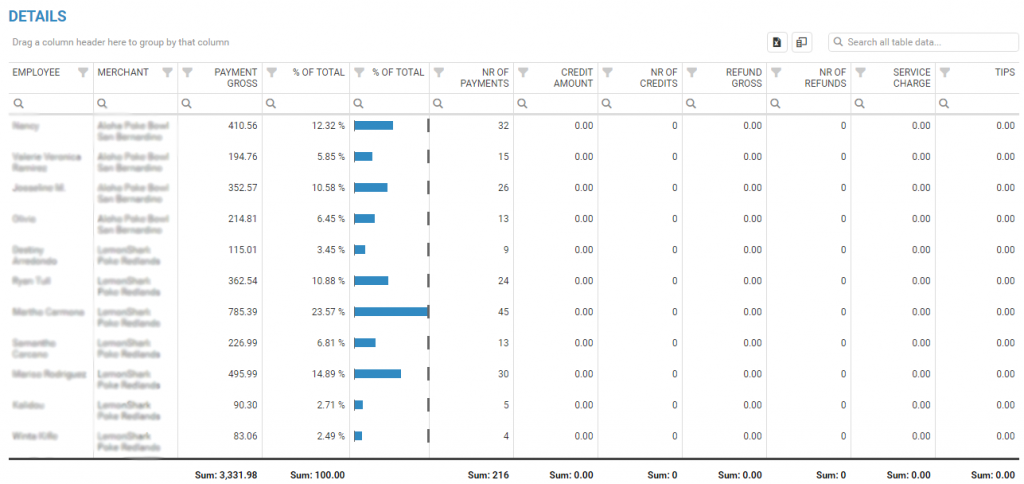
It is followed by two charts and detailed table in which you can find more details about your employees as well as the possibility to export that data to Excel.
Also, charts can be exported with one click to different formats so you can use them in your monthly/quarterly/yearly reports.
You can find out how much each and every employee contributes to your company by seeing a number of gross payments they earned, or a number of payments made by them. Spot best workers by a quick glance over charts or by looking at bullet charts in the table that are showing you percentage amount earned by the specific employee in a desired period of time.
- REVENUE PER EMPLOYEE REPORT
This report is similar to Payment type report ‘Employee Overview’. The difference is in processing data, in the first-mentioned report, we are associating employees with payments, and in this report, we are associating them with orders.
You can access this report from the menu as shown in the picture below:
Reports – Order – Revenue per Employee
Report facts:
- Report is based on Orders
- Slower load of a Report (provides more details)
- Period selection up to 62 days
- Very detailed reports
The report shows Employees info from Orders created in the selected time period.
In a case where one employee is under multiple different names in multi-location setup (for example Mike P., P. Mike, Peterson M., Mike Peterson) it makes a mess of the report and is hard to track. For this purpose, we added Nickname and CustomID columns to give you better control over this situation.
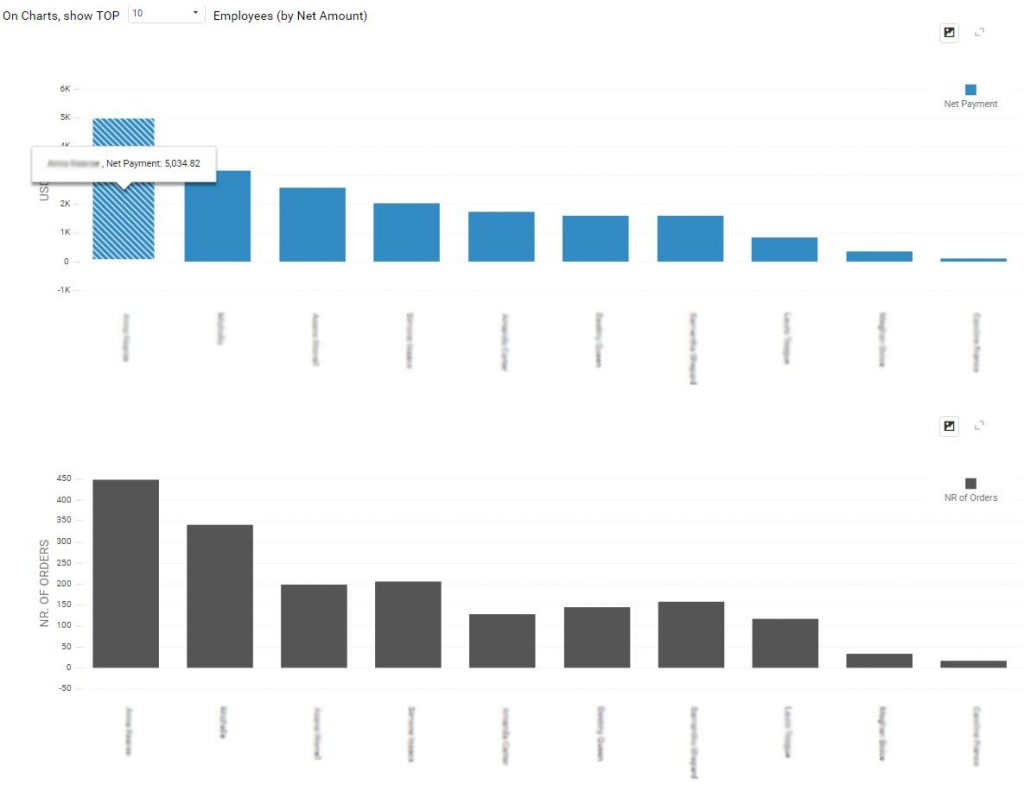
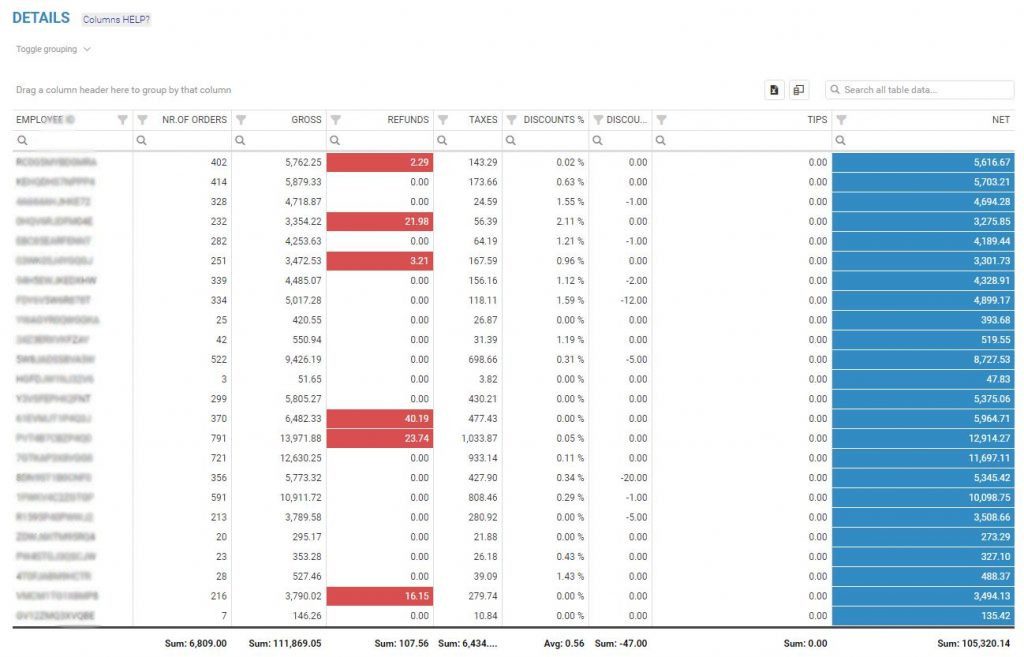
This report has 3 charts, first one is showing you Top 10 (or 25, 50, 100) Employees by Net amount, then the second one is showing you amount of Orders made by Employees and the last one is visualizing average Net payment per employee followed by detailed table where you can arrange different information you need as you like with possibility to export it to Excel.
A detailed table is showing you the number of orders made by employees with their Gross, refunds/discount amounts.
We hope you will find these reports useful and in addition to this reports, we also offer ways to adjust commissions per employees which is very useful if you wish to stimulate your workforce.
You can read more about it at the following link: Commissions demystified
If you have any questions, please do not hesitate to ask
Happy Analyzing!
Your Analytics for Clover Team
Related posts


