Since the early days, people are faced with making decisions based on choices at the…
Marketing Dashboard in BusinessQ
Hi, everyone!
Do you like Marketing Dashboard in BusinessQ way?
Or are you still struggling with excel “reporting”?
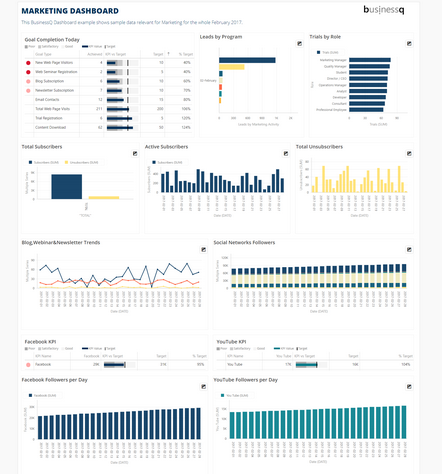
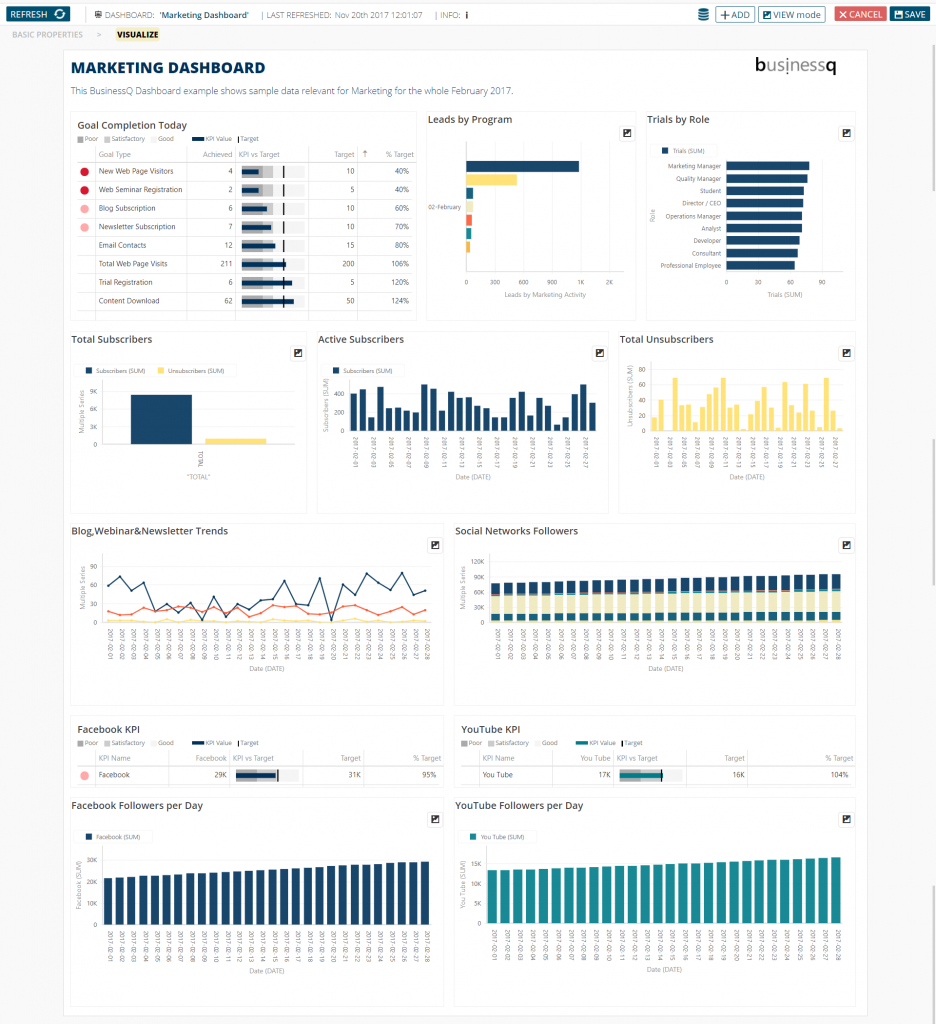
In our example of the dashboard, you can see many relevant things, like:
- most important KPI’s (e.g. in “Goal Completion Today” you can easily see which goals aren’t achieved – dark and light red dots shows who is under KPI goal).
- With bar graph (here named “Total Subscribers”), you can easily see do you have more subscribers or unsubscribers, for example.
- You can also track in which month you had the most unsubscribers and further analyze what could be a reason for that.
Click image for LIVE DEMO link.
In BusinessQ you can create your own dashboards with data that are most important to you. We hope that we gave you some good ideas.
Every day we are trying to make BusinessQ better for you, so if you have any questions and/or suggestions contact us on info@qualia.hr .
We are developers of data visualization software BusinessQ. Try it for free and make reports and dashboards that make sense, without chart junk.
Related posts