Whether the type of business you are in, customers are your backbone. Without customers, no…
Analytics App – Revenue per Vendor
Hi, everyone!
In today’s blog entry for our Analytics App for Clover, we are explaining how to find out revenue per Vendor in our Revenue per Item label/tag report.
As the holidays are approaching, many merchants are asking us how to use our Analytics application so they can find out which vendors items were top sellers in the period of holidays last year, so they can carefully choose which items to order/stock and by doing that possibly maximizing their profits. That doesn’t need to be the only reason why you should do it, it is very useful to know which item is associated with which vendor throughout the whole year so you can see which items from these vendors are being sold and which are not.
Clover doesn’t offer you a special input box where you can type vendors name in it and associate it with that item but it allows you to write Labels (name changed from Tags).
So for each Item you have added to your Clover station, you have an option to adjust/write Labels. And if you decide, one of these labels can hold a vendor name!
If you assigned vendor names to items, you can use Revenue per Item Label/Tag report to analyze orders in our Analytics App:
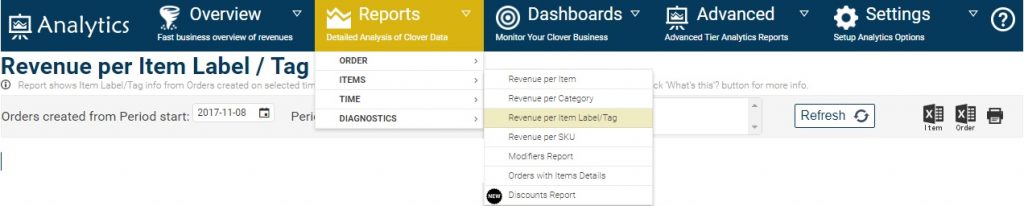
You can access report as shown in the picture below:
Go to Reports->Items->Revenue per item Label/Tag
Once you opened up the report, select a time period you wish to analyze by clicking one of the ‘day’ buttons or by selecting custom period from the calendar:
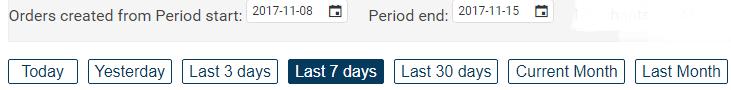
Once you select date and press refresh our application will fetch data from Clover and fill the charts and tables with it.
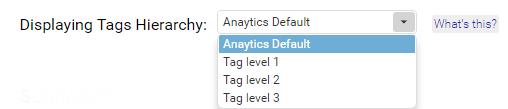
Important thing is to be consistent when applying vendor name to item label as if you decided that it will be on label#1, it should always be on that label, otherwise, the report might show you wrong information if you made mistake. Analytics App allows you to analyze first 3 labels/tags on items and ‘Analytics Default’ being label #1
That’s why you will see following Tag Hierarchy select box where you can choose one of the 3 labels/tags you assigned in clover (be sure to select the vendor one)
After you have selected appropriate label which holds vendor name you can use the rest of report to export charts to one of the formats, re-arrange table by dragging columns, removing columns to column chooser and if you decide, exporting re-arranged table data with one click to Excel for further analysis.
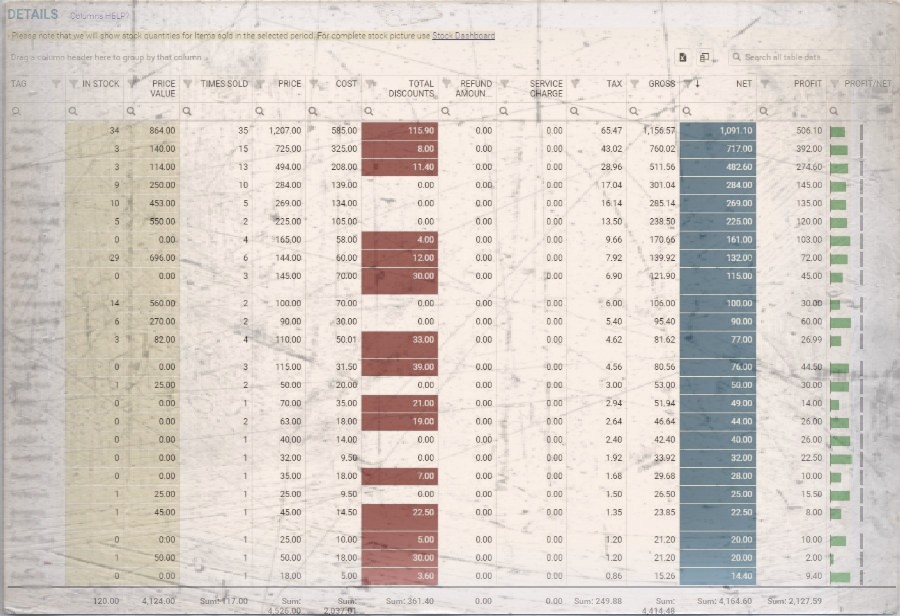
You will see summary which will show you the number of your vendors (# of tags) with other valuable information made in the selected period of time like Gross amount, Service charge, tips, refunds, Tax amount and NET values.
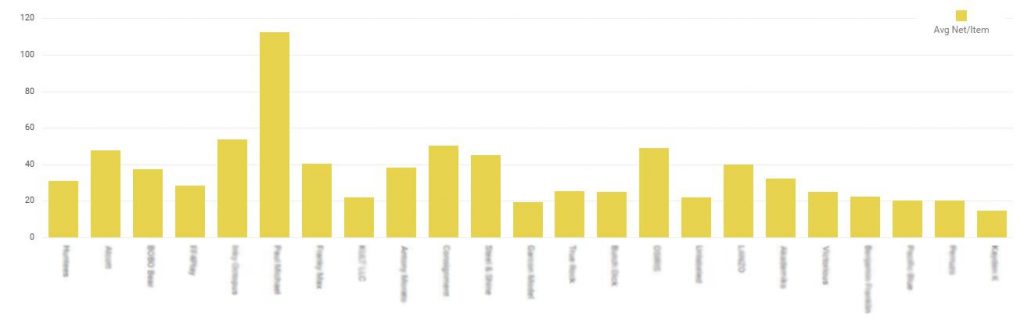
After quick summary, you will see three charts where you can see NET payment per ‘label/tag’ (read per Vendor), Nr. of items sold from that Vendor and Average Net/per item from those Vendor label/tag
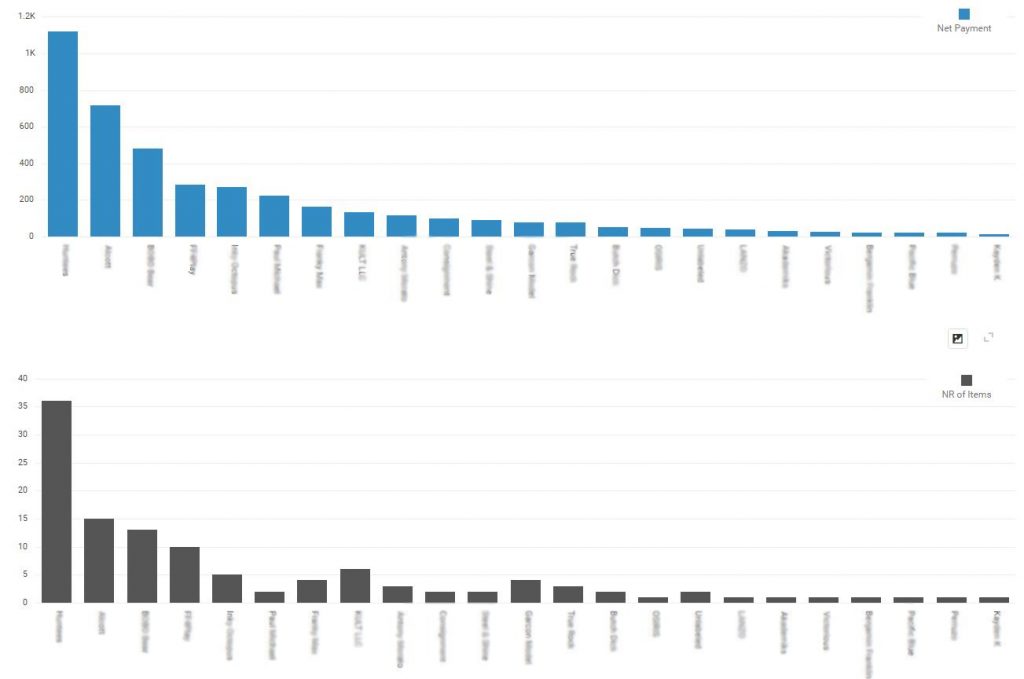
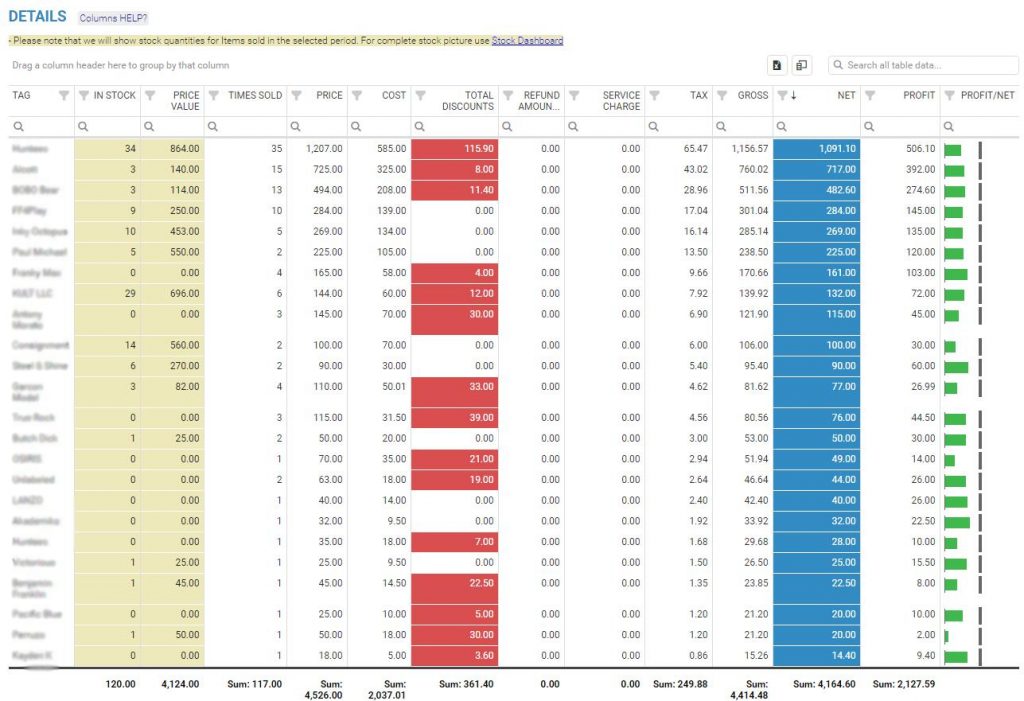
Followed by the detailed table where you can see which vendors are giving you the most profit, how many items from that vendor you have in stock and other information:
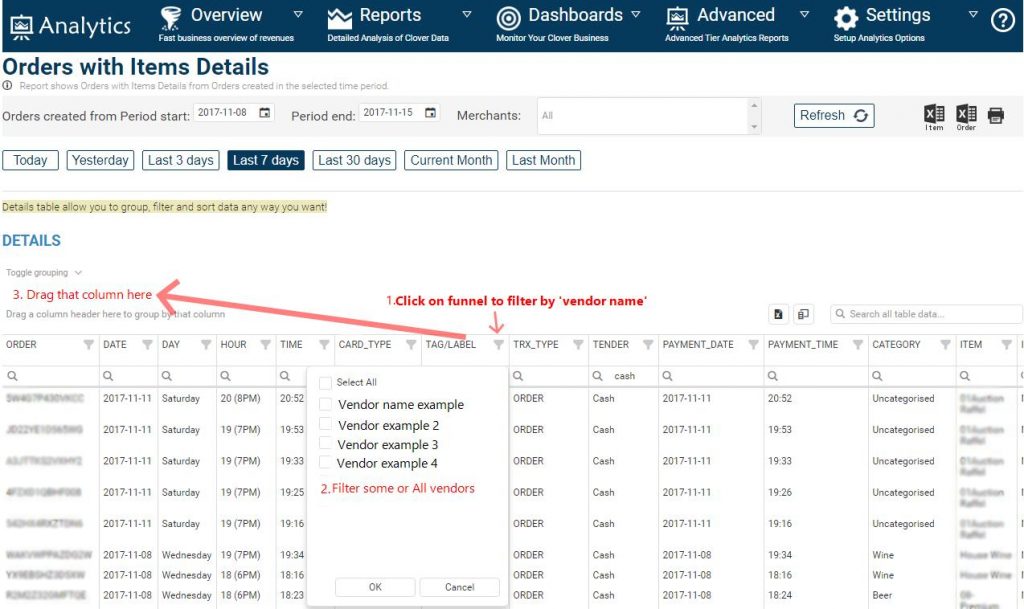
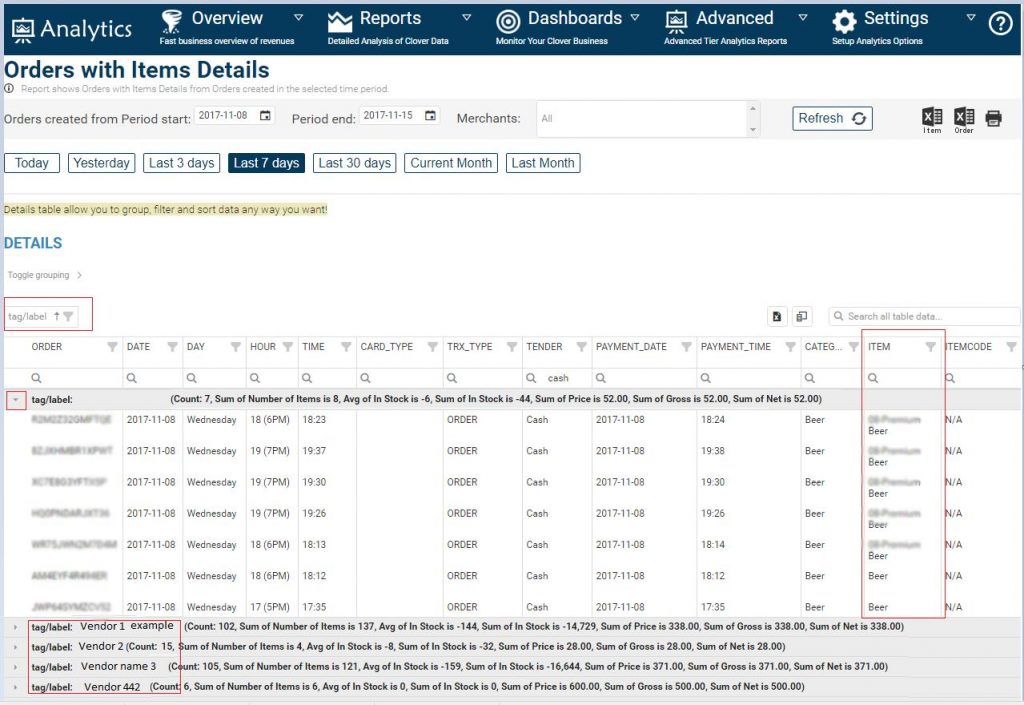
Alternatively, if you want to find out items which are being sold from specific vendor you can use reports Full orders details or Orders with items details where you group table by that label/Tag, or even easier if you are using Advanced tier, choosing Tag1, Tag2 or Tag3 columns in Pivot Item Level data report.
Example of Orders with items details report and how can you find all items from a specific vendor:
Click on a funnel icon on column Tag/Label. There you can filter all available vendor names/labels (if you set vendor names as label 1 in Clover)
Drag and drop that column as shown in the picture below:
And you will have table grouped by that Vendors name and you are able to see all of its items sold in the selected period of time. You can collapse/expand rows and export table with one click to Excel:
We hope you can use this new information to your advantage and if you have any questions, please do not hesitate to ask
Happy Analyzing!
Your Analytics for Clover Team
Related posts


