Whether the type of business you are in, customers are your backbone. Without customers, no…
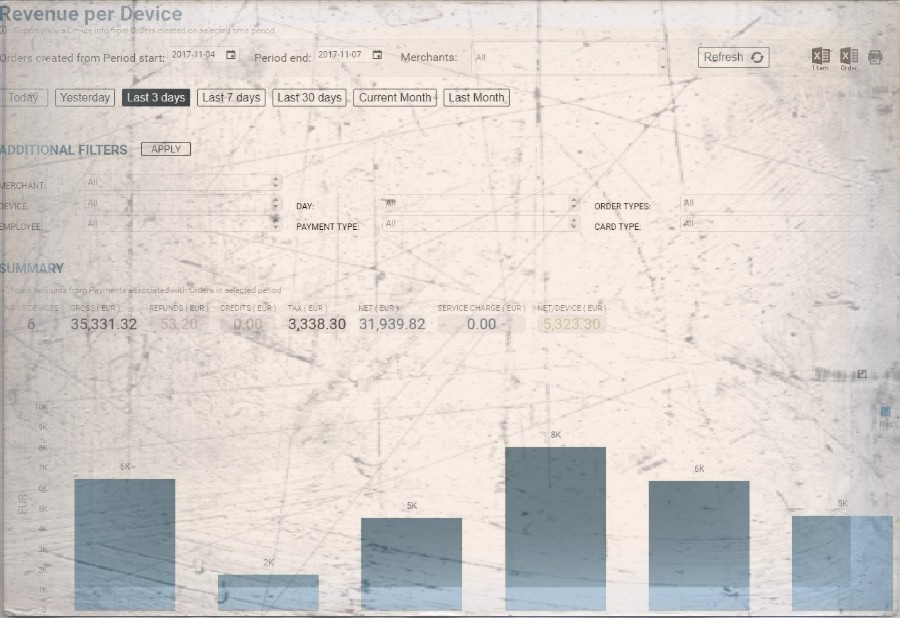
Analytics App – Reporting by Device
Hi, everyone!
In today’s blog entry for our Analytics App for Clover, we are explaining how to use report Revenue per Device.
Whether you use Clover Flex or Clover Station or even better if you are combining multiple devices in operating your business then Revenue per Device report is the real deal for you.
If you have a two,three-floor bar/restaurant/store and all those devices are spread around in designated areas of your choice, you can easily see revenue per each device, you can find out for each employee registered on specific device, how many orders they have made, their Gross, NET values per as well as refund amounts, tips and discounts in selected period of time you wish to analyze.
Report facts:
- Report is based on Orders
- Slower load of a Report (provides more details)
- Period selection up to 62 days
- Detailed report
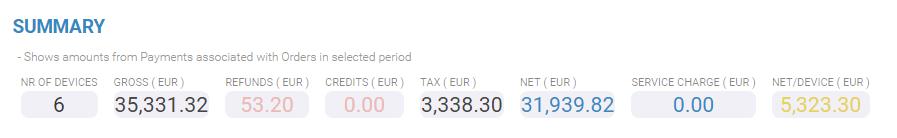
Once you open up the report and select period of time you wish to analyze a summary will show up with following information:
- number of devices you are using
- Gross revenue in selected period
- Refund amount
- Credits amount
- Tax amount
- NET amount
- Service charge amount
- Average NET/per device
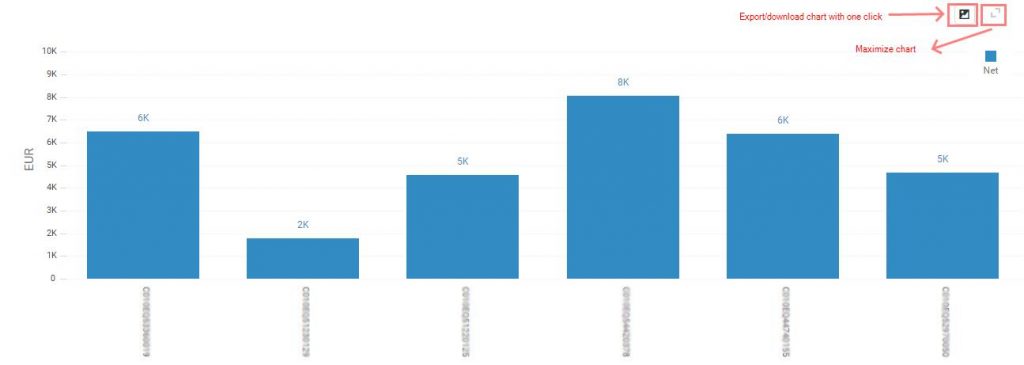
As we all know, pictures are worth thousands of words. That’s why we are showing you three charts after the summary with following information:
The first chart will show you Net revenue per device where you can easily see which device is performing well and which isn’t. Knowing/seeing this information might push you to do some changes in order to boost revenue on that device ‘location’.
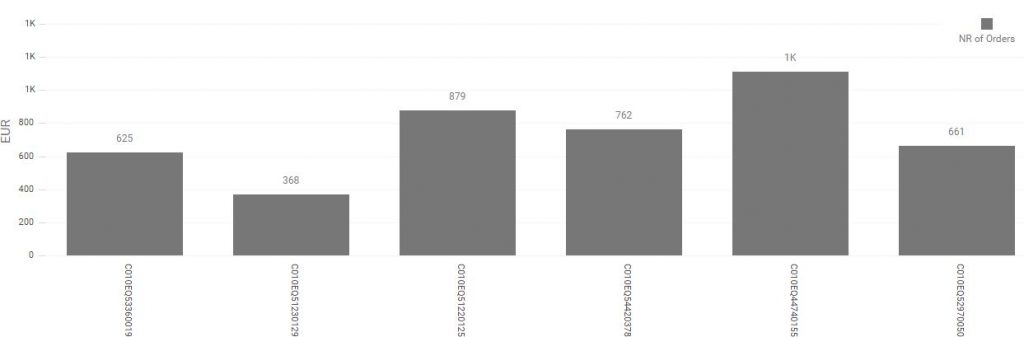
The second chart will show you a number of orders that happened in a selected period of time per each device.
The third chart will show you average NET payment per device
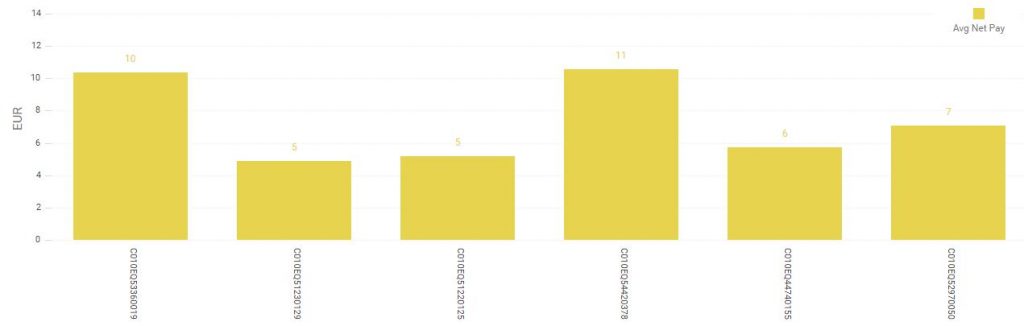
Each chart has one-click export to various formats like pdf, jpeg, png, gif… which then you can use in your presentations or for whatever reason you might need these charts.
And at the bottom of the report a detailed table with following information:
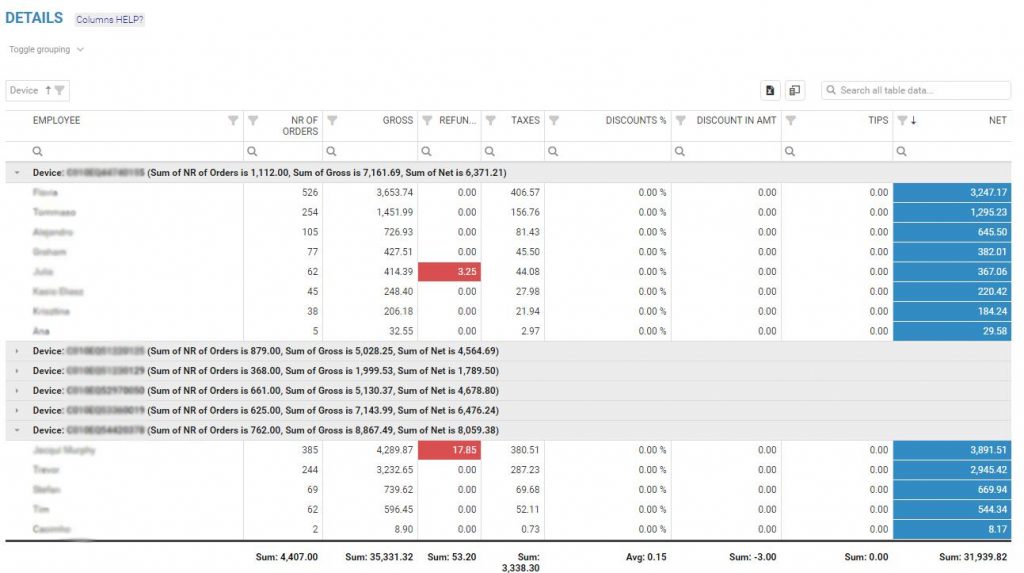
In this case, the table is grouped by device, so you can see from each device their employees and their nr.of orders, gross, refund, taxes, discounts, NET and other valuable information.
Each table in Analytics Application can be re-arranged by dragging columns and dropping them where you want to position them. You can hide columns that are surplus to you. Export whole table to Excel with just one click or even print whole page. Easy filtering and searching of information that is on the table or for complete report by using ‘additional filters’ at the top of the page.
We hope that this report is valuable to you and if you have any questions, please do not hesitate to ask
Happy Analyzing!
Your Analytics for Clover Team
Related posts


