The future of business data visualization
Today is a big day for us. We’re thrilled to announce that our data visualization software, SaaS BusinessQ 16, is here.
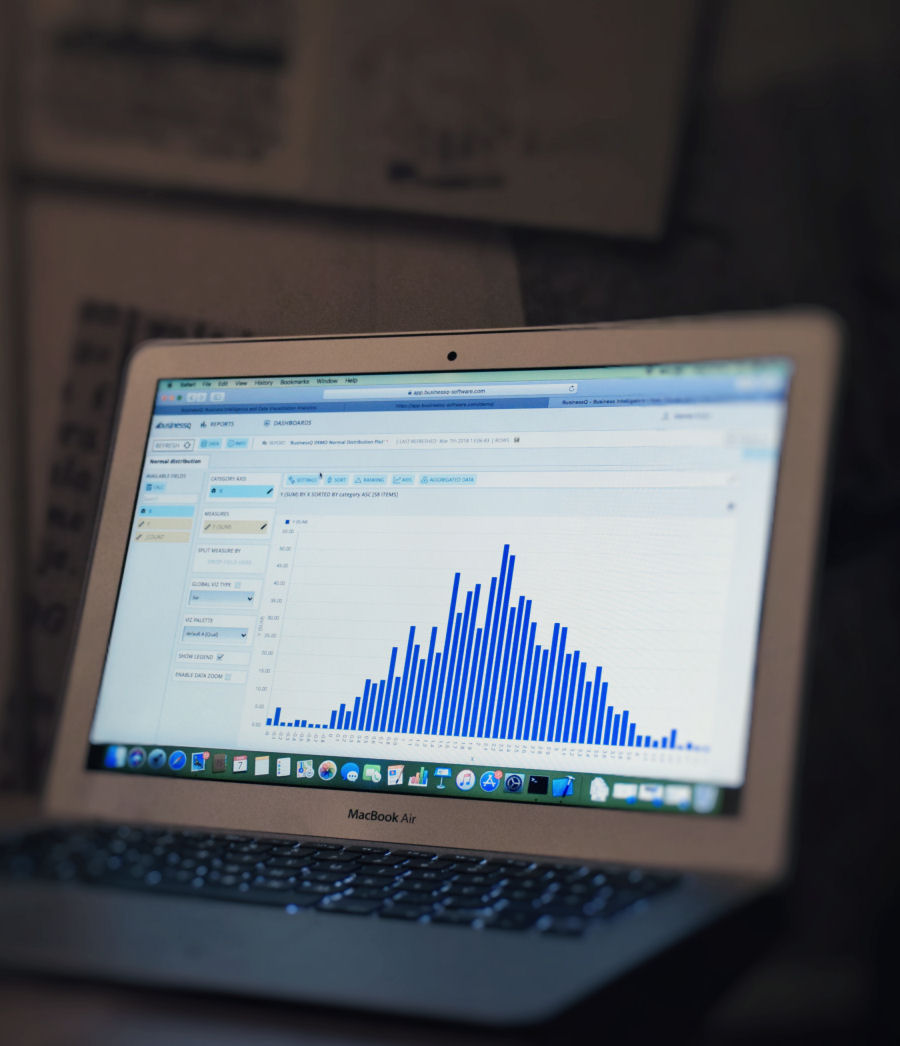
We were very busy in the last months to convert our BusinessQ completely into HTML5 app. That enables you to run your dashboards and reports from any device, at any time.
WHY BUSINESSQ?
Every company, no matter how big or small, needs Reports. Daily, Monthy, Yearly Reports, Performance reports, Controlling, Reports for administration, Reports for Management… Use BusinessQ to get new reporting ideas, to create Reports and share them. Create appropriate Dashboards and take action on what is really important; stay up-to-date with what’s going in your business.
BusinessQ is all about making that easy and fun while maintaining data visualization integrity. Spend time reading Reports, not making them!
If Data is poorly represented, the BI project will fail
Without proper data visualization your are stuck with mere numbers and you’ll spend hours trying to understand them
Raw data can only be valuable when it is understood, and not just when it is available
Our brain is pattern-detecting software; BusinessQ is leveraging that fact
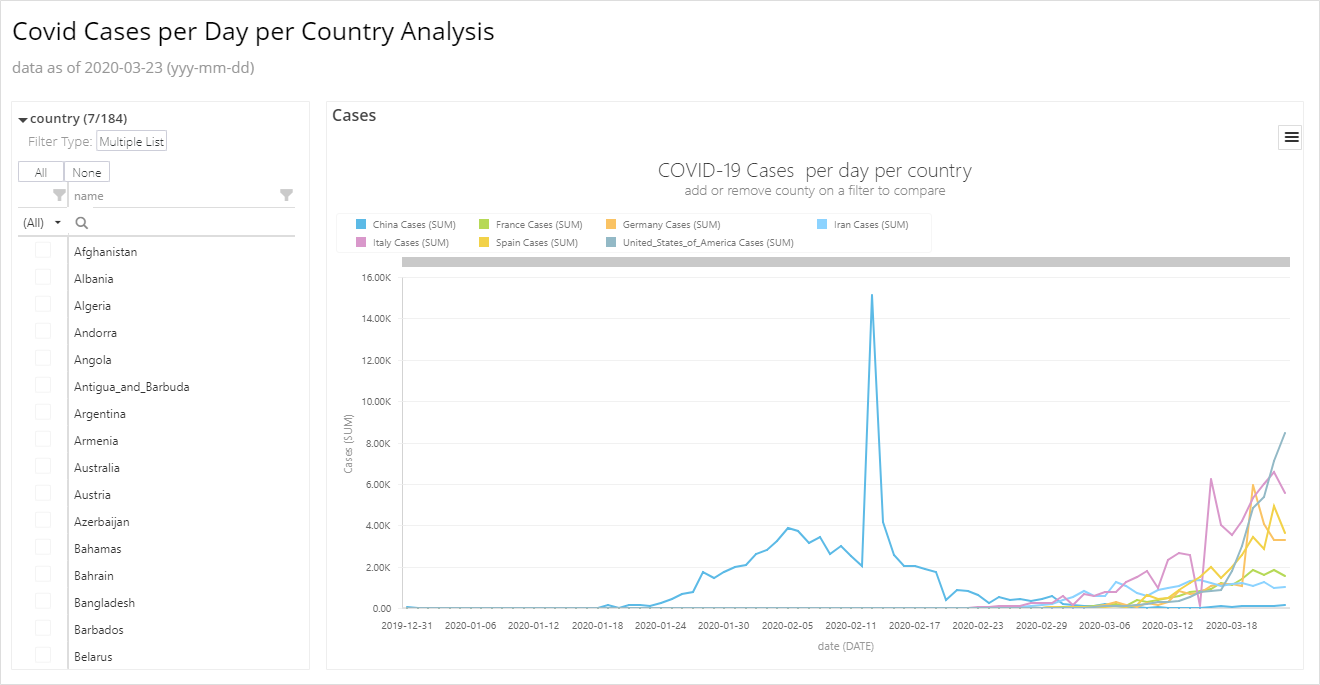
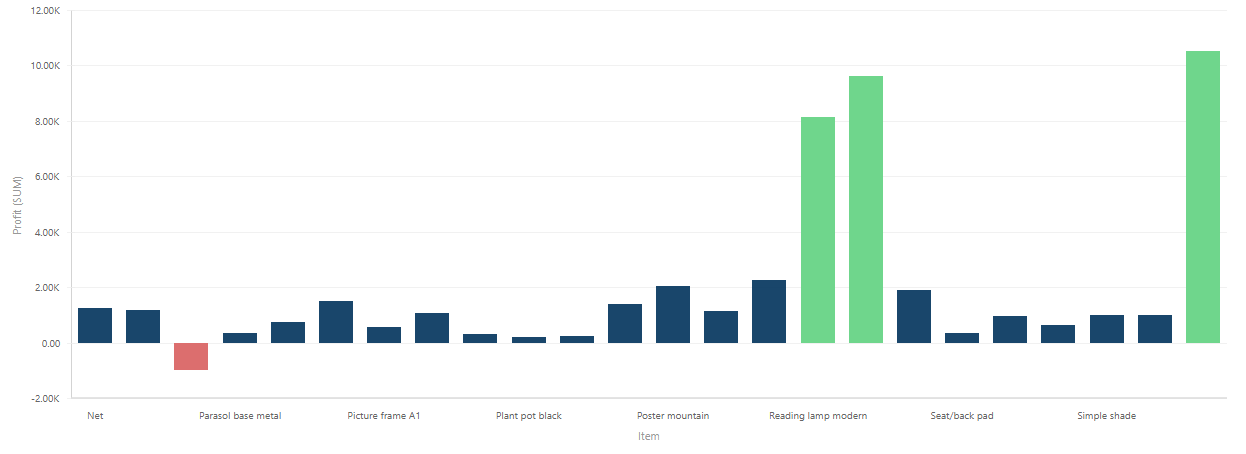
BusinessQ has built-in best practice data visualization
Business Dashboards are not here to entertain managers, but to inform them
We are developers of data visualization software BusinessQ. Try it for free and make reports and dashboards that makes sense, without chart junk.


