Whether the type of business you are in, customers are your backbone. Without customers, no…
Analytics Profit Overview
Profit Overview Report
Today we want to present all the features of Profit Overview Report in our Analytics for Clover App.
This Report is available from the BASIC App Tier.
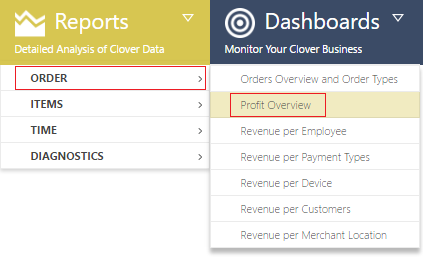
You can open it via Reports menu:
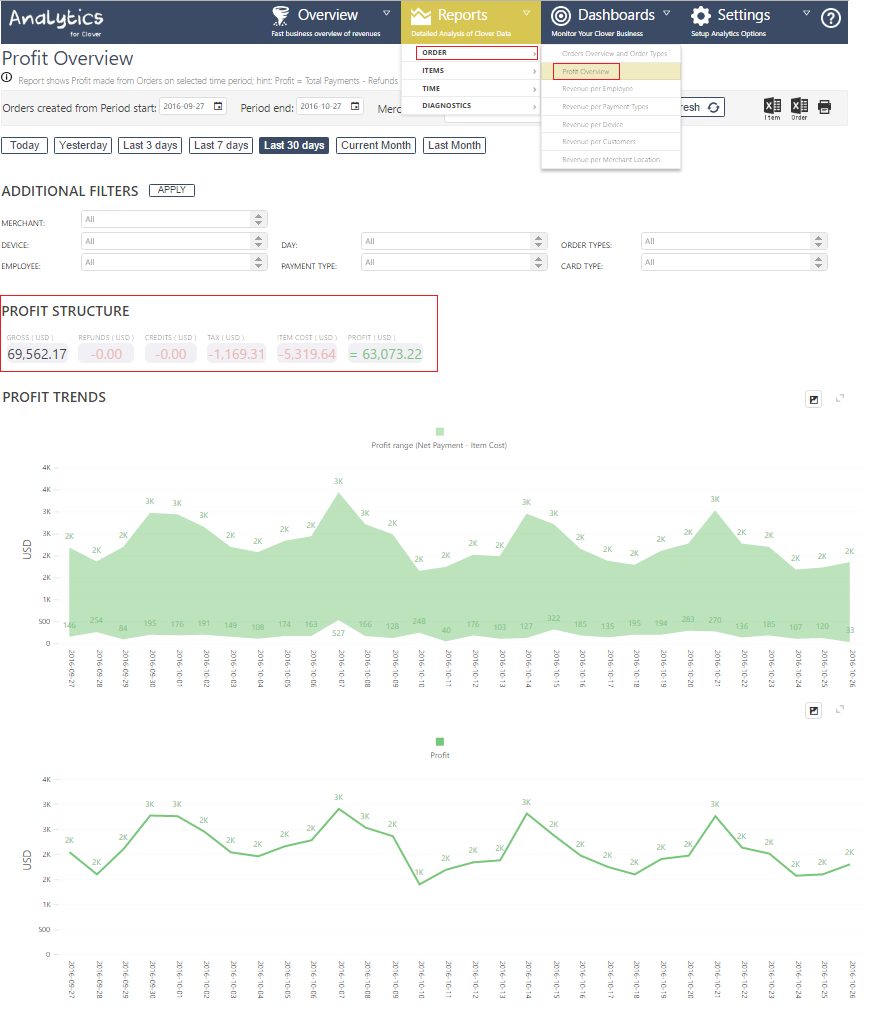
You can select custom date filter range on period start / end fields, and press Refresh to get the data:

Maximum allowed period range for BASIC Tier is 90 days, while for FREE Tier it is 7 days.
Alternatively, you can click on one of our predefined date range filters:

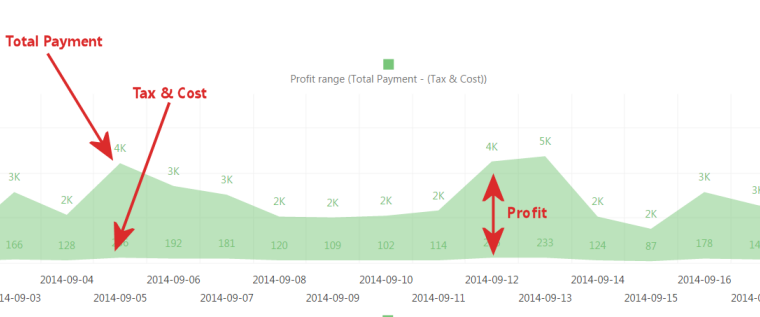
Your profit is calculated as
PROFIT = TOTAL PAYMENT – TAXES – COSTS
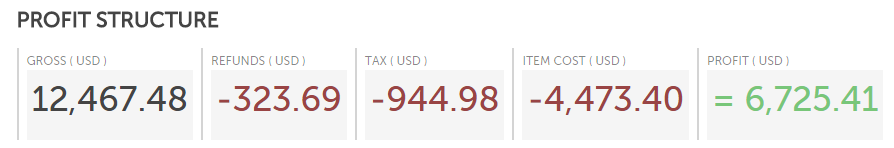
We will get Cost part from your Clover Items data. If you do not have Costs on your Clover Items, Profit will be Net Payment – Taxes.
Profit Trends chart is great way to see which days were the most profitable ones. The green area represents Profit, the bigger green area is, the bigger profit is.

On the last chart you can read what Profit was in absolute amount, by Date:
As a conclusion, Profit Overview Report is a powerful tool for monitor your total payments, tax amount, cost amount and profit by Date.
If you are looking for place to get started, check out our Analytics webpages.
If you have any questions about how to use Analytics, just contact us .
We are dedicated to offering you amazing support and we’re happy to help you get started.
Thanks,
Your Analytics for Clover Team
Related posts


