Whether the type of business you are in, customers are your backbone. Without customers, no…
Analytics Category-Item Dashboard
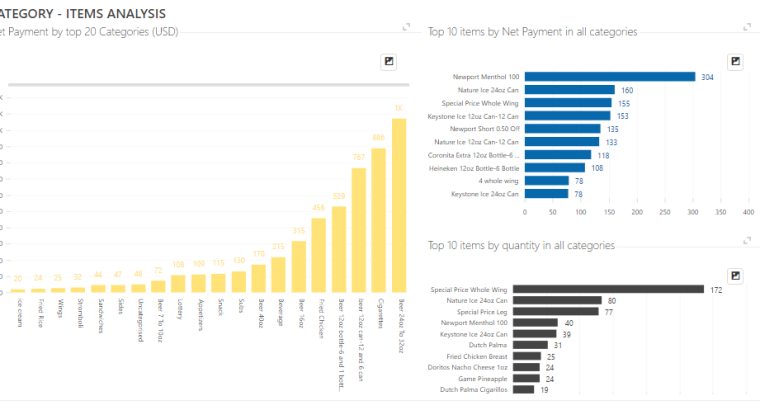
Category / Items / Tag Analysis Dashboard
Today we want to present all the features of Category / Items / Tag Dashboard in our Analytics for Clover App.
This dashboard is available from the BASIC App Tier.

You can open it via Dashboards menu:

Top 10 Items charts will inform you about most popular items (by quantity) and items that brings most of your revenue.

When defining Items in Clover, you have a possibility to put a LABEL / TAG on each one of them.
You will want to do that in order to achieve some kind of additional categorization, super-categories or similar.
If you do that, you can use following dashboard chart to read the revenues per item LABEL/TAG:

As a conclusion,Category / Items / Tag Analysis Dashboard is very convenient report and analysis tool to realize what item categories are the best ones, to analyze all the items in one category or overall, to realize what is your revenue per item labels/tags and more… This Dashboard will inform you on all important business aspects of your items, categories and labels/tags.
If you are looking for place to get started, check out our Analytics webpages.
If you have any questions about how to use Analytics, just contact us .
We are dedicated to offering you amazing support and we’re happy to help you get started.
Thanks,
Your Analytics for Clover Team
Related posts


