Whether the type of business you are in, customers are your backbone. Without customers, no…
Analytics Month to Date Performance
Month-to-Date Performance Dashboard
Today we want to present all the features of Month-to-Date Performance Dashboard in our Analytics for Clover App.
This dashboard is available from the BASIC App Tier.
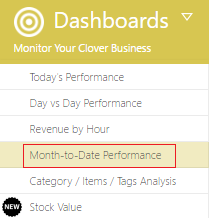
You can open it via Dashboards menu:
First of all, what is Month-to-date (MTD)? If you are looking the dashboard on 19-Sep, then Month-to-date means period of 19 days from the beginning of the September until 19th of September. This dashboard will compare Revenue and Number of orders from MTD period with Last Month Period.
What is it good for? If you are looking at performance on the end of the month and you see that you already achieved values from the last month, you can consider this month as successful one.
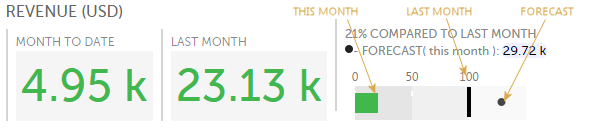
On the above picture we can see that so far this month (4.95k) we are on 21% of Revenue from the last Month (23.13k). Moreover, we can see that is we keep up in the same pace, we will earn 29.72k in Revenue by the end of this month (FORECAST, presented with the black dot ).
The same metrics you can see about Number of orders, too.

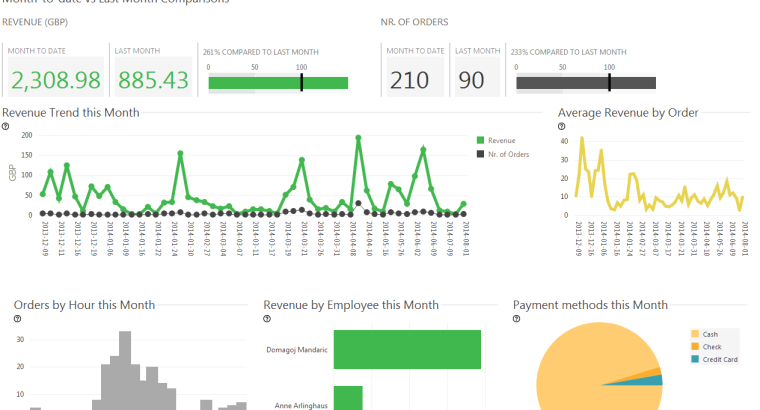
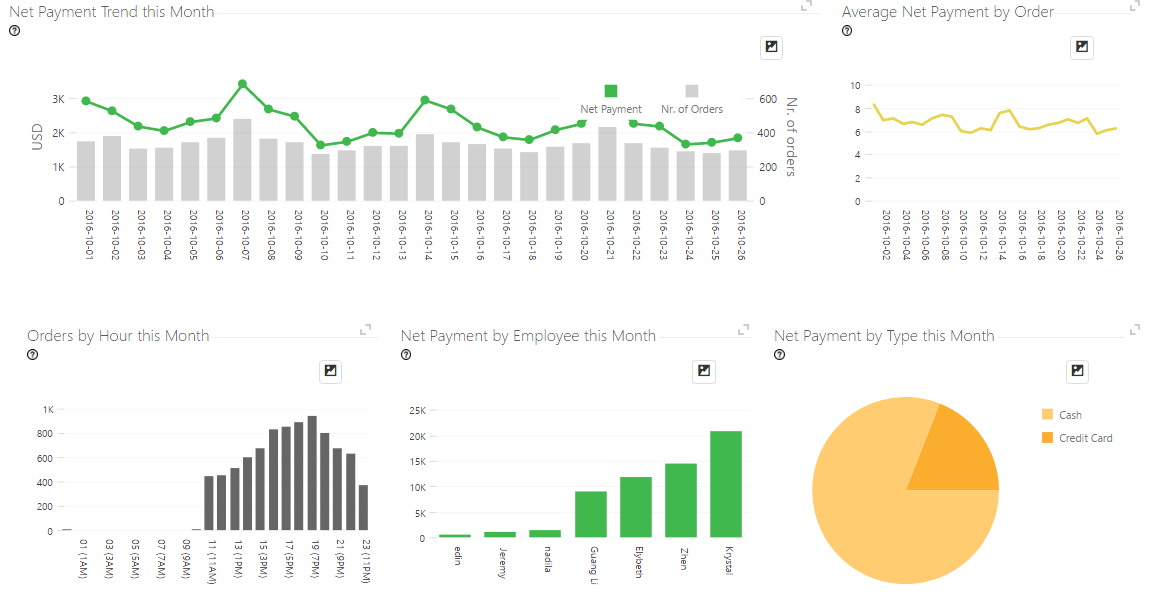
On Revenue Trend section you can track trend of your incomes per day. See if you earn more on weekends, if your revenue is constantly rising of maybe declining?

On Average Revenue graph track on which days you have the biggest orders:

Number of Orders by hour distribution is great to see when is the peak of your selling activity during one day. You can see, for this month, how much orders do you have on every hour. Maybe from this chart you can decide to transfer employee to help here on some hours, or you will decide that you can close earlier because revenue is not so big after 10pm, for example.

Check how much Revenue does every your employee brings to you:

… or how much you earn per payment method. By Cash, Credit Card of something else?
As a conclusion, Month-to-Date Performance dashboard is a powerful tool for monitor you business, to compare current month with the last one, even to see forecast for Revenue. This Dashboard will inform you on all important aspects of your business on monthly scale.
If you are looking for place to get started, check out our Analytics webpages.
If you have any questions about how to use Analytics, just contact us .
We are dedicated to offering you amazing support and we’re happy to help you get started.
Thanks,
Your Analytics for Clover Team
Related posts


