BusinessQ 16 bubble plot dataviz
BusinessQ 16 bubble plot dataviz example
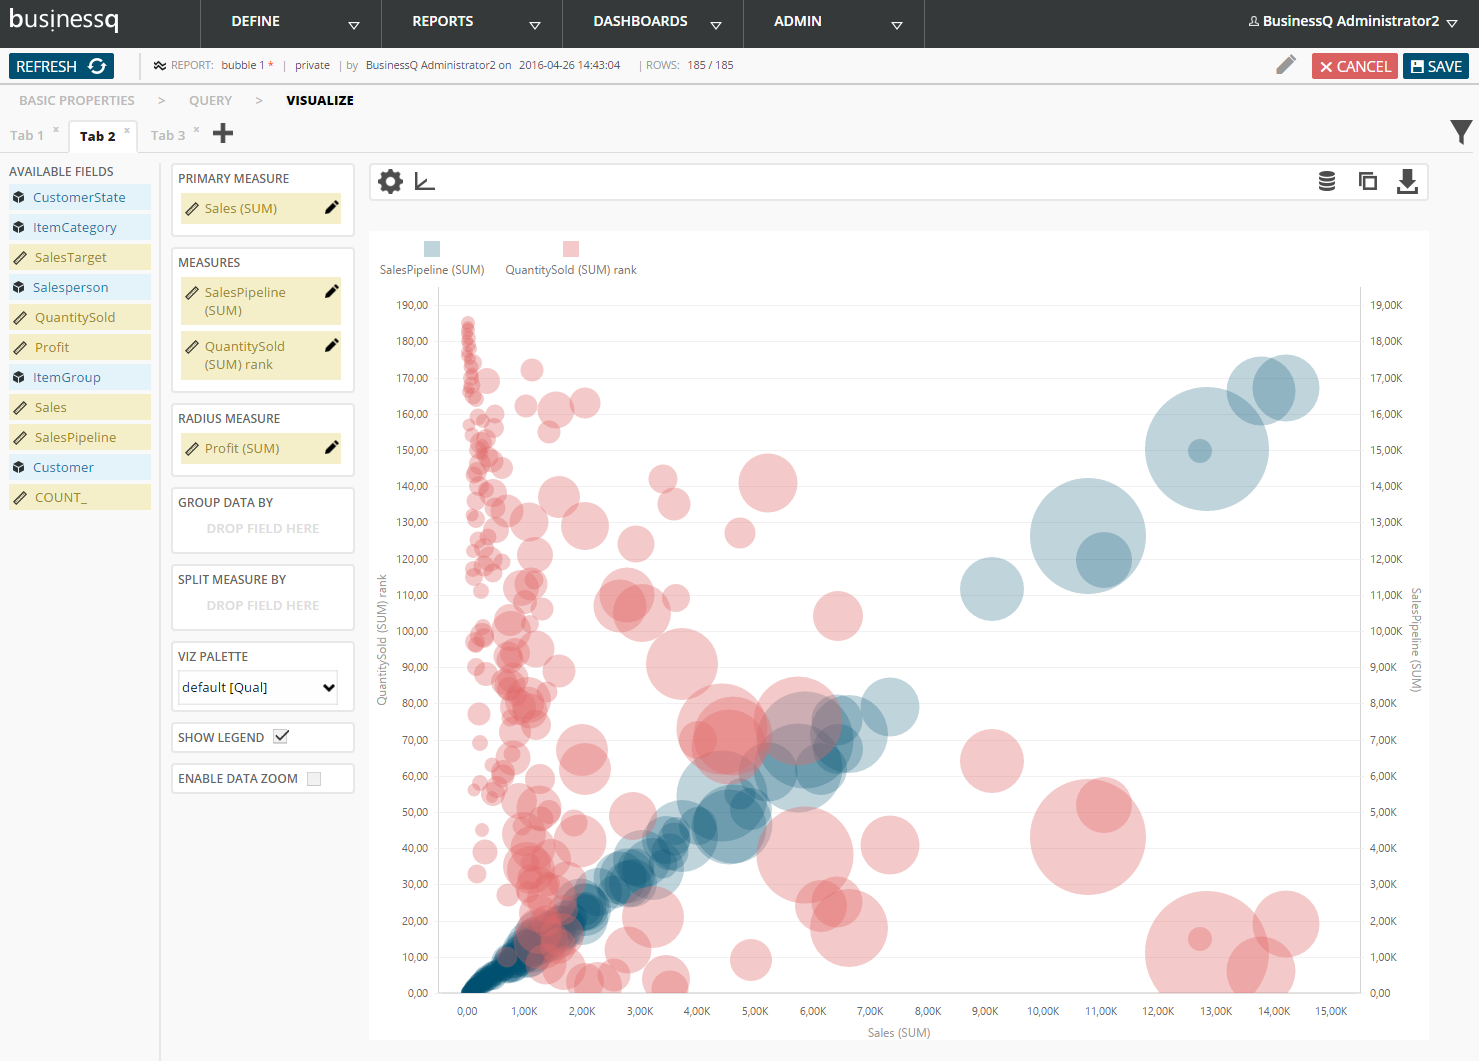
In BusinessQ software, select appropriate data visualization from our carefully selected VISUALIZE tabs.
This is an example od Bubble chart;
Usage: Correlation
We are developers of data visualization software BusinessQ. Try it for free and make reports and dashboards that makes sense, without chart junk.
Related posts