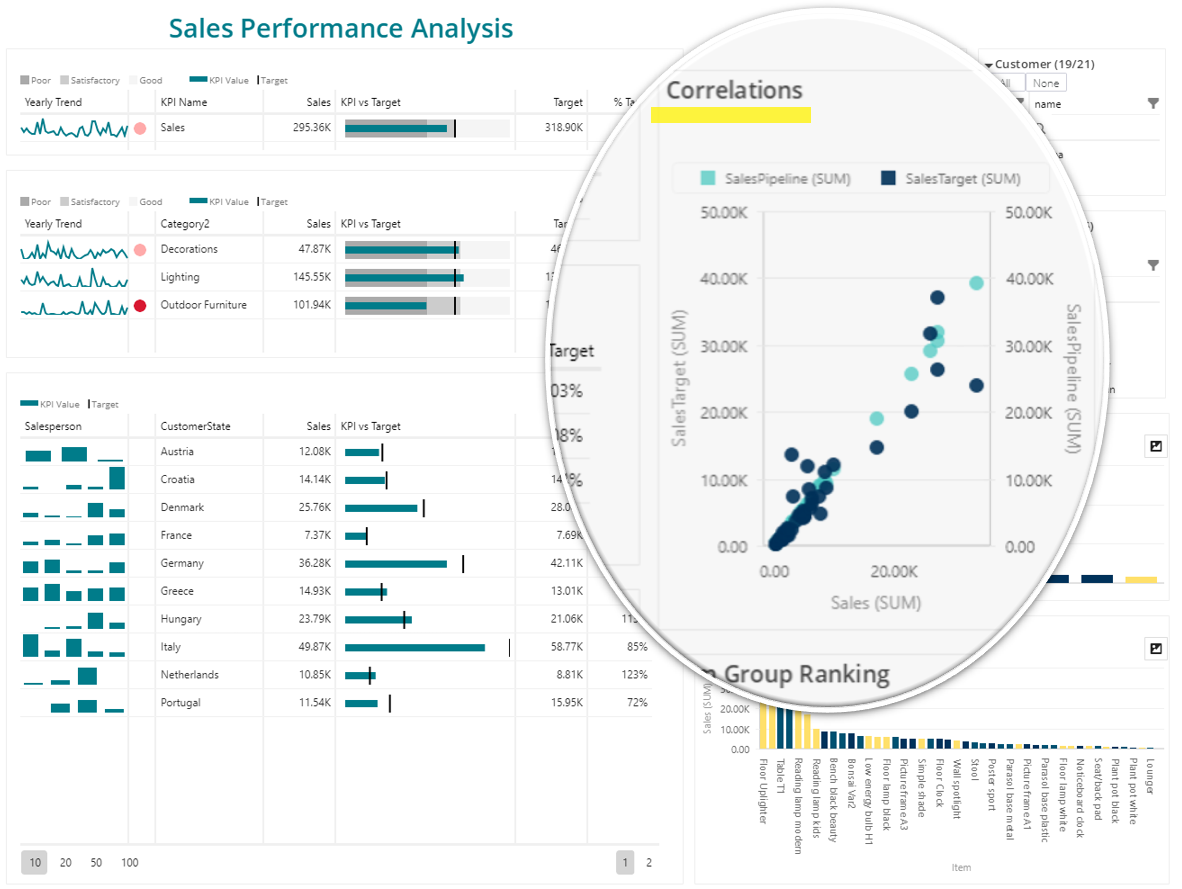
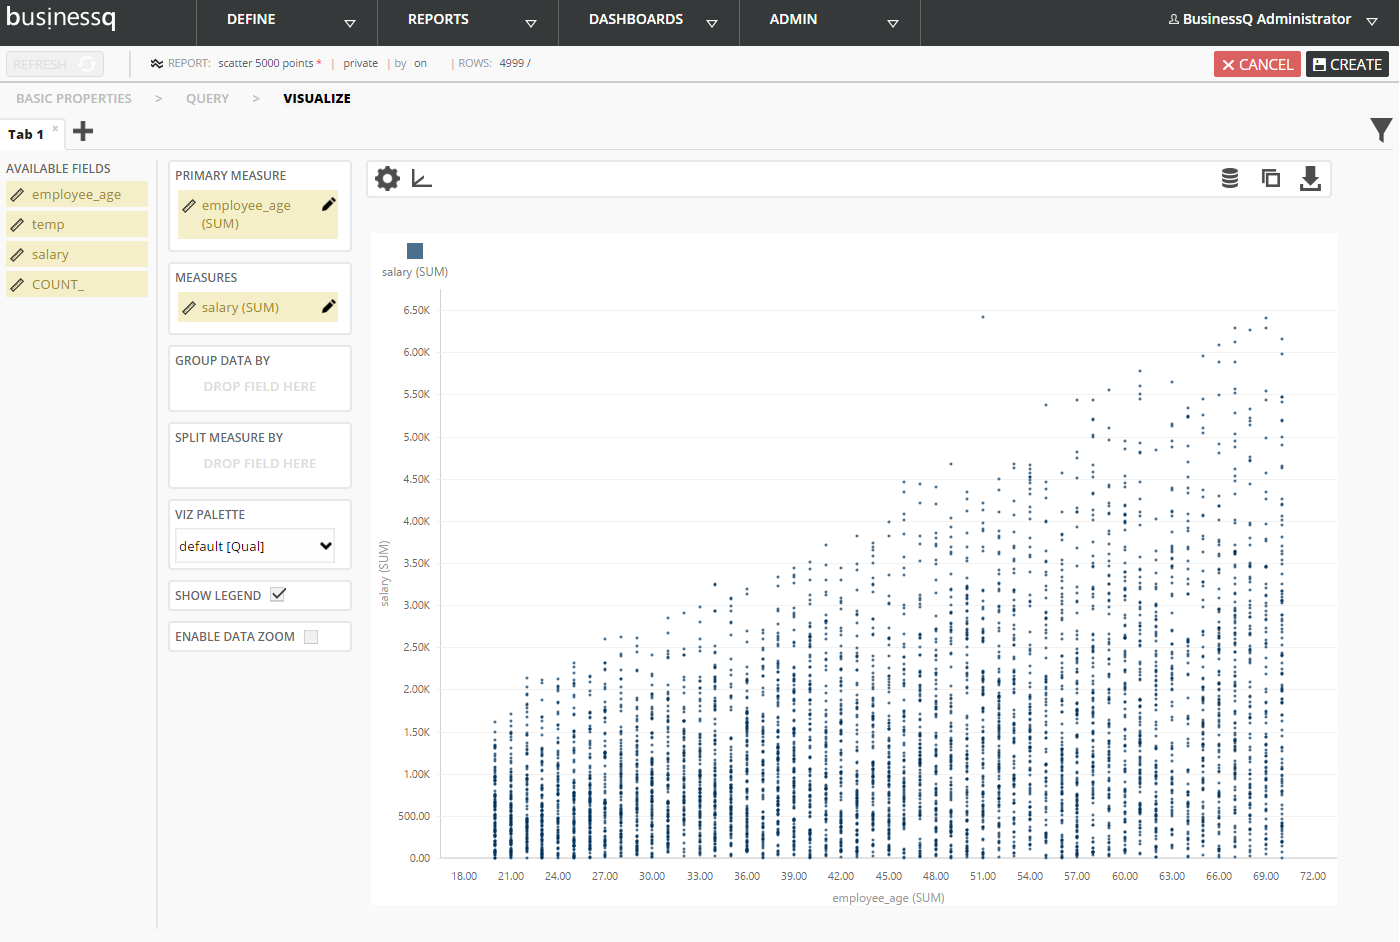
SCATTER PLOT: Definition and examples I BusinessQ
Definition Scatter plot is a powerful, two-dimensional data visualization tool. It can provide the decision maker with a lot of information. This visualization uses dots to represent the values obtained for variables plotted along the axis x and the other…


