LINE CHART: Definition and Examples | BusinessQ
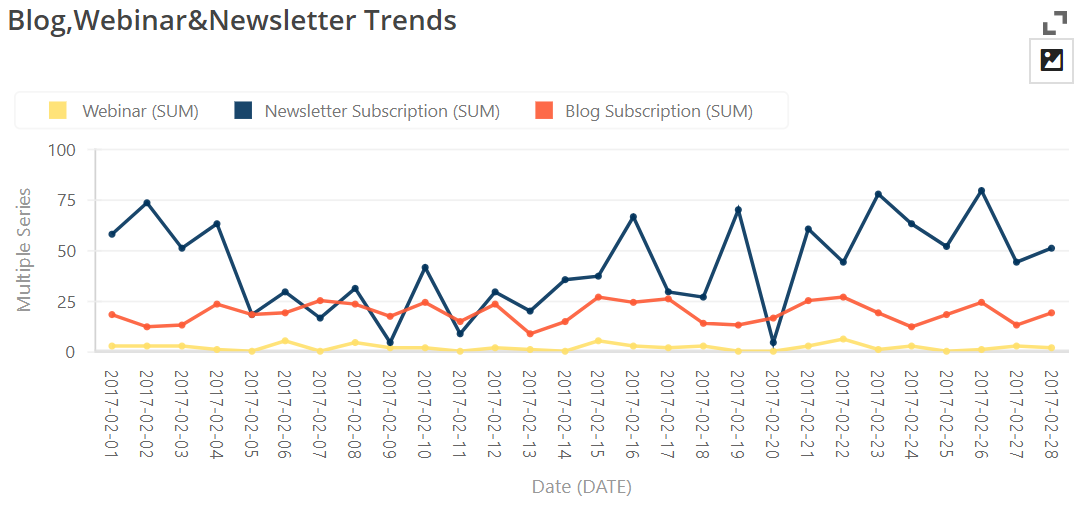
Definition A line graph is a chart that uses one or several lines to “show patterns in the data, such as trends, fluctuations, cycles, rates of change and how two datasets vary in relation to one another.”[1] The live presentation…

