

Basic information
What is Payments app for Clover?
Payment Insights app is tailored for merchants on the Payments Plus Plan. App provides detailed and visual Reports and Dashboards based on your Payments, for ALL your LOCATIONS! You can access it on any device via a web browser, at any time.
The Reporting tool helps merchants keep track of payment DETAILS, date and hour TRENDS, payments per EMPLOYEE, CUSTOMERS, TENDER, and more… The Analytics tool lets merchants generate multi-dimensional analyses for their business.
Please note that while this app will work for all merchants, on any plan, it is tailored for merchants on the Payments Plus Plan. Merchants on the Register Lite or Register Plan should check out the original Analytics app by Qualia for a more feature-rich experience!
Installing Payments App
You can get Payments for Clover on Clover App Market here:
1. For US market: ![]()
2. For EU market: ![]()
How to: Install
To install Payments, just go to Clover App Market, select Payments and click on the INSTALL button
Choosing Payments App Tier
Payments Application provides one Tier to choose from
- STANDARD
TIER DIFFERENCES:
Here is a table with all available reports in the Standard tier:
Report name
REPORTS SECTION
Payments Details
Payments per Customers
Payments Trends Analysis
Payments per Hour
Payments per Employee
Payments Types
Payments per Card Type
Payments: Multi Location
STANDARD
Prices for US and EU markets you can find here.
Free trial and billing
Free trial and billing
The first time you download and install any tier of Payments App you will enter a 30-days free trial on the Payments Standard tier. During this period, you will not be charged and you will have access to all of our reports. At the end of the 30-days free trial, you will be charged for the tier you originally selected. If you uninstall Payments App before the trial expiration date, you will not be charged anything.
A free trial is available only within the first 30-days of installing Payments. For example, if you installed the Payments app five days ago and now you wish to try out the Standard tier, from the moment you start the Free trial, you will only have 25 days of free trial left.
Canceling subscription after passing of the free trial period
Subscription can be canceled anytime via the Clover app market. In that case, you will be refunded for the amount of time you didn’t use Payments. Example: You installed the Payments App and the free trial is now over. You get charged for the next month. You wish to continue using it for another week. After that week you wish to cancel. You will be charged only for that week, and you will be automatically refunded the rest of what you paid for the whole month (in this case you will get ¾ of the whole month amount refunded).
Uninstalling Payments App
How to: Uninstall
As we are 3rd party developers for Clover and we can’t install nor uninstall Payments app for you. You will need to do it yourself by going to the Clover dashboard.
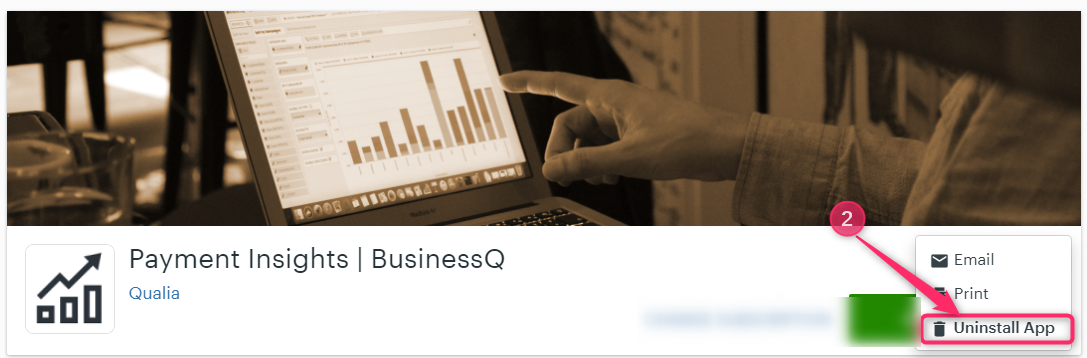
In Clover Dashboard go to Installed Apps. Find Analytics app and select the following option:
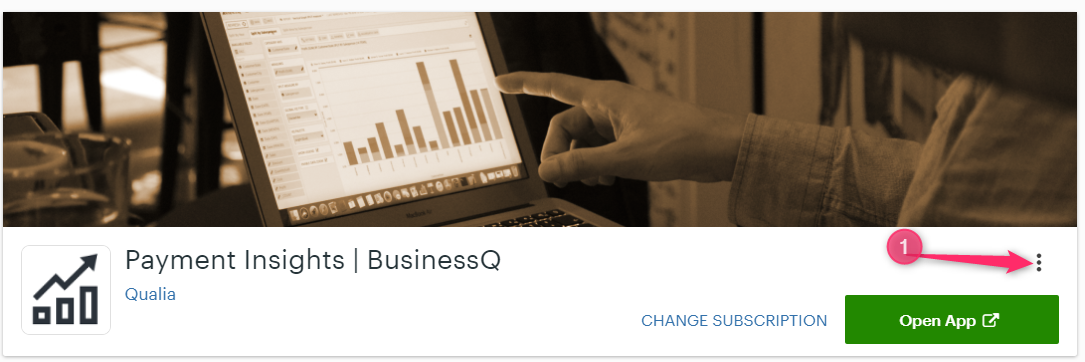
After you clicked on three dots as shown in the picture above you will get to the option to Uninstall App
Payments App Reports
In this article, you will find several basic information about reports in the Payments app like what type of reports we have, what are the most usual parts in all reports, how you can find the right report for your needs, etc. All the information that you can find here is general. Each report is explained in detail later on.
Report type based on tier
Reports in Analytics app are divided into two main groups:
- Free – reports that come in Starter tier
- Standard – reports that come in Standard tier
More on which report belong to which tear you can find here.
Reports in Payments Insights app are Payment based reports
Available reports are:
- Payments Details
- Payments per Customers
- Payments Trends Analysis
- Payments per Hour
- Payments per Employee
- Payment Types (Tenders)
- Payments per Card Type
- Payments: MULTI LOCATION
Usual reports sections:
Most of the reports in the Analytics app have been built from several parts that are repeating in all the reports.
The report name and explanation box
Here you will see the name of a report and short explanation. On the left, there is a star. If you mark it yellow, it means it is a favorite report.

Report period box
The second box is usually a box where you define a period you want to analyze. You can either use quick period time buttons you can quickly select the time period you are interested in. The period you selected will be highlighted in dark blue. The period box you can find in all reports.
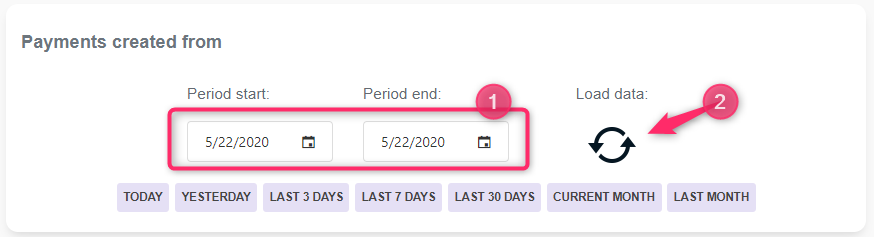
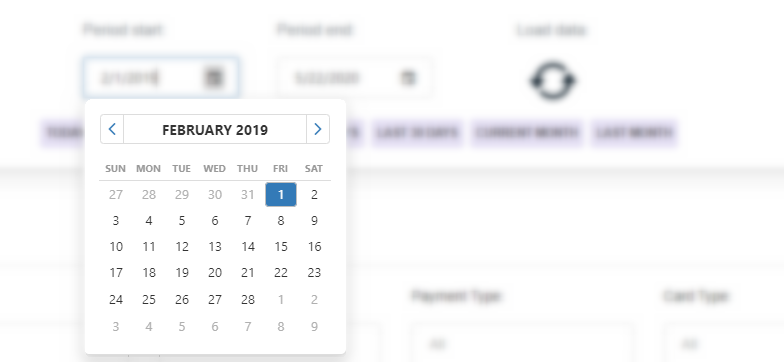
If those quick period time buttons are not enough, you can select the period manually by selecting a calendar icon and choosing a period start date/ end date and clicking the “Load data” button.
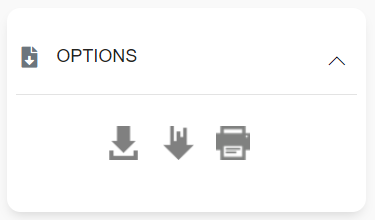
Options
In option box, you can find several options like printing or downloading a CSV file with all orders or items information. CSV files you can find in order based reports.
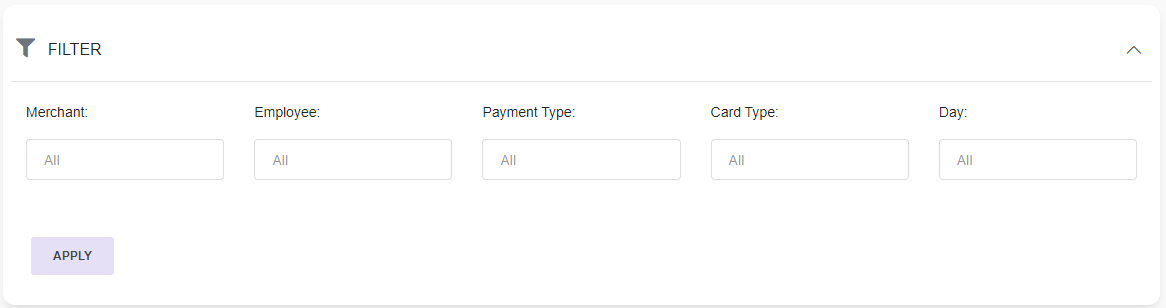
Filter box
In the filter box, you can find some values for additional filtering in reports. Filters vary from report to report.
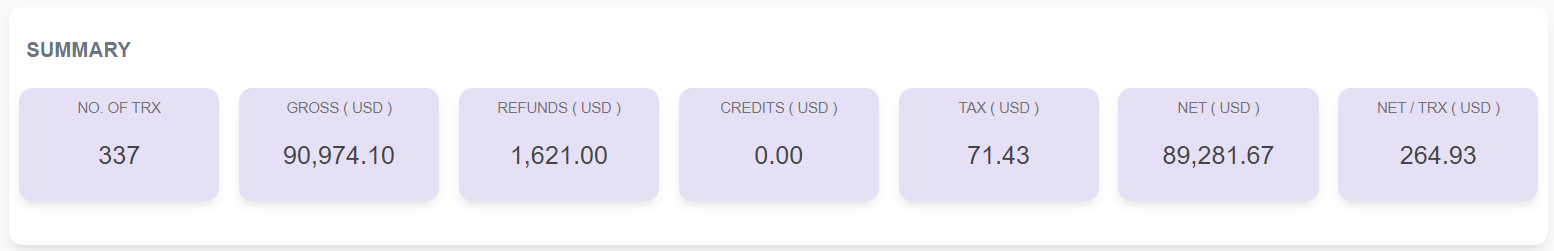
Summary box
In this box, you will find different summary data. Data depend on a box. Most of the reports in Analytics have this part.
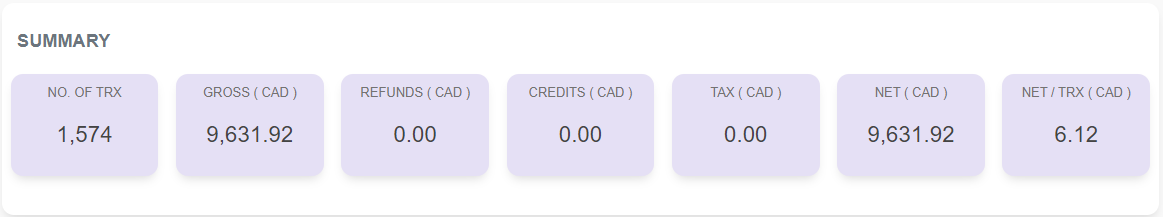
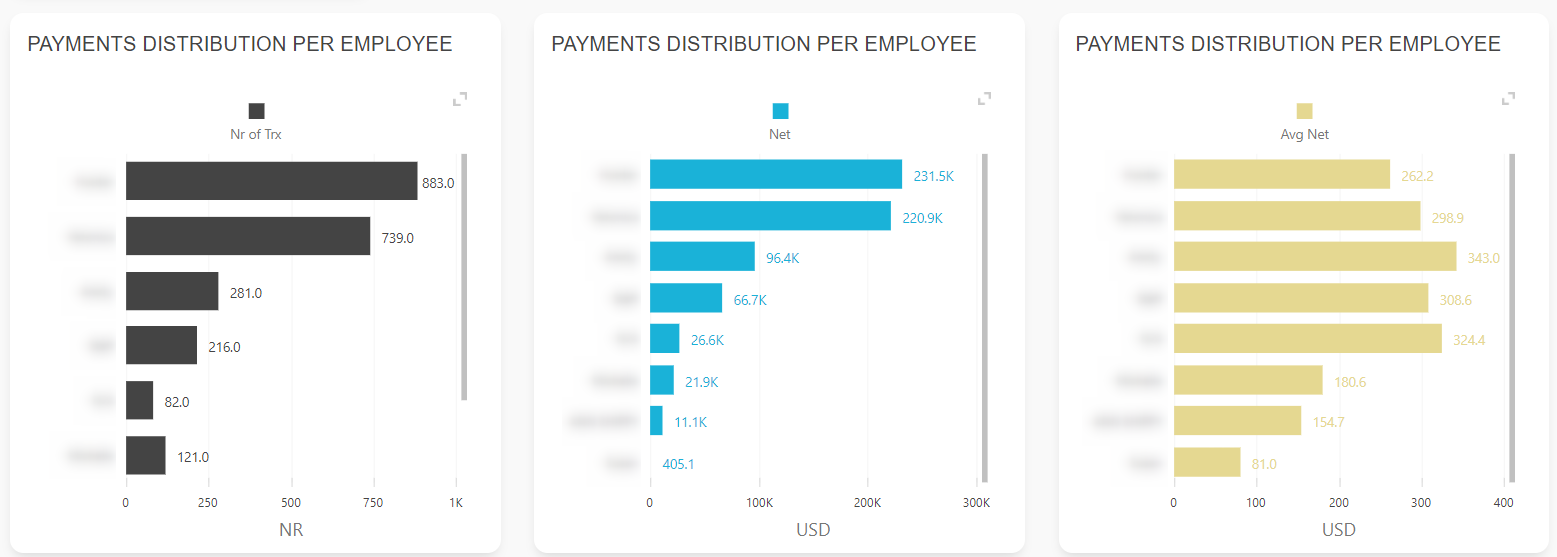
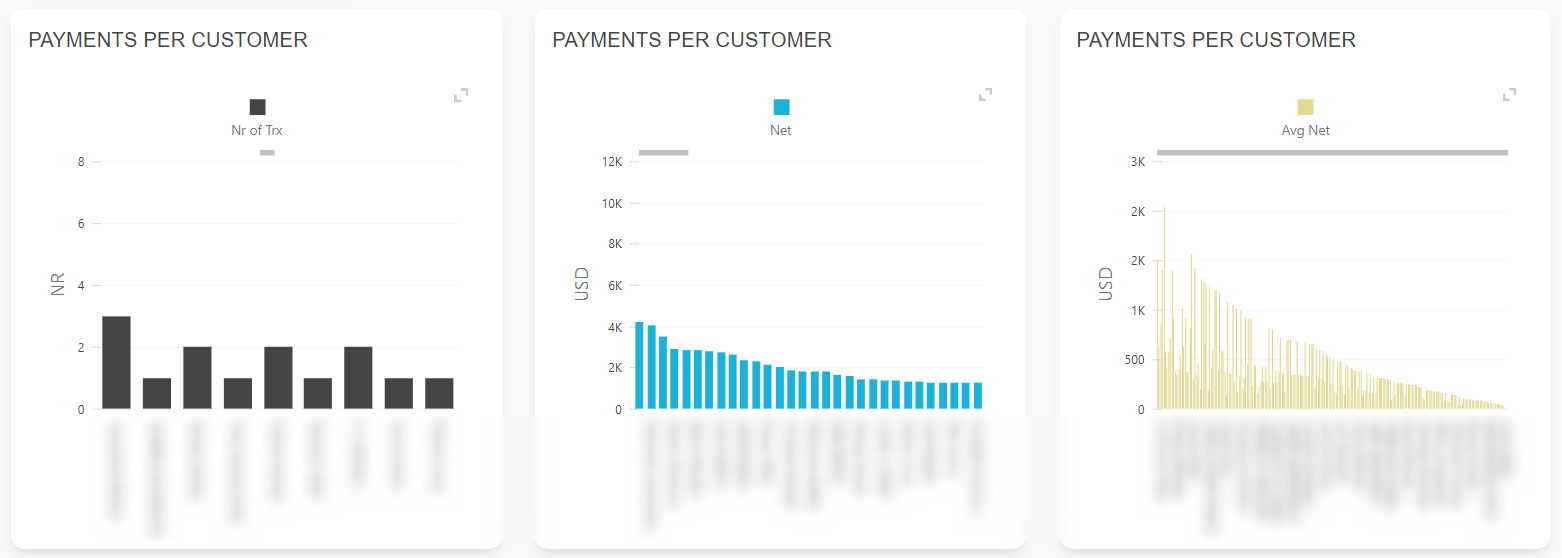
Chart section
For some, the chart section is most important. Charts are a quick and visual way you get basic information. Charts vary from report to report and more from period and data to be presented. Here are some examples.
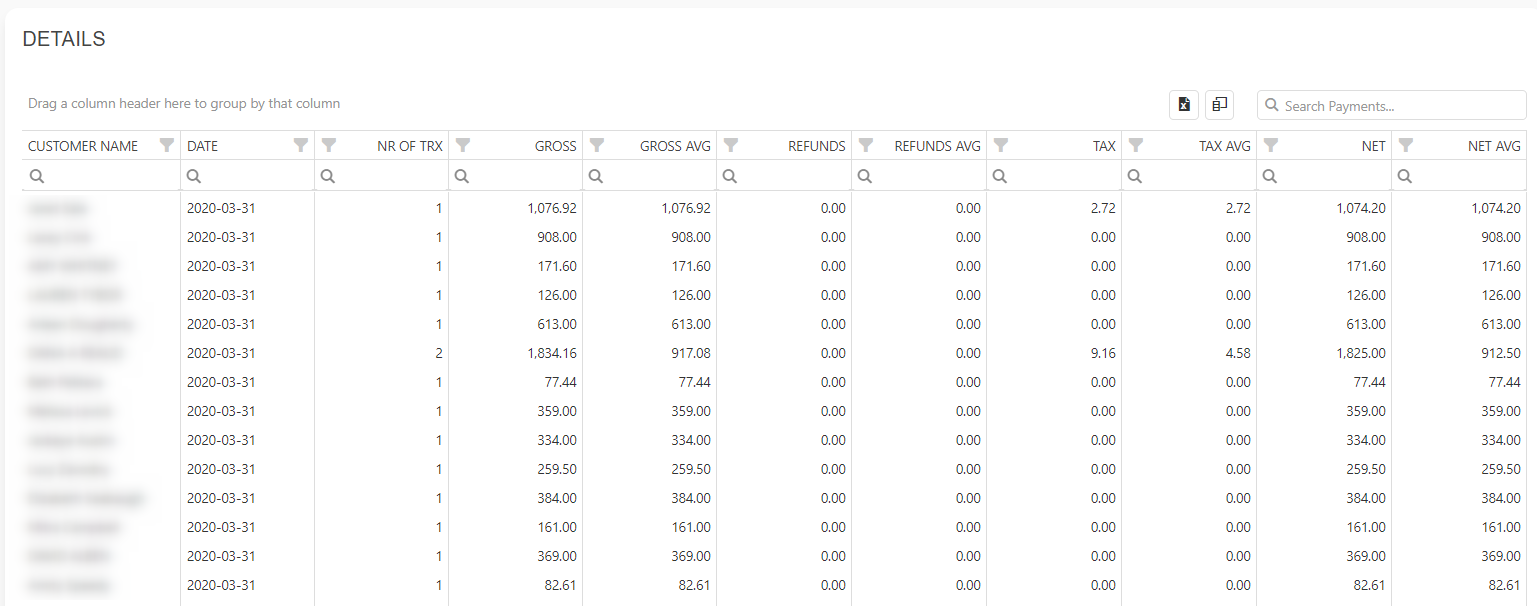
Details section
In the details section in most of the reports, you can find one or more tables. The details section with tables is always on the bottom. Just scroll down in a report and you will see tables. Most of the tables in Analytics have the same possibilities like:
- Add/remove columns in “Column chooser”
- Export table to excel
- Rearrange columns (move columns left, right)
- Group by one more values
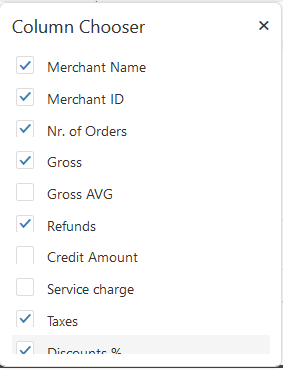
After clicking on “Columns chooser”, you will see all values that could be presented in the table. Just click those you want or unclick if you don’t need them.
Payments Details
Report facts:
- Report is based on payments
- Very Fast Report
- Period selection up to 1 year
- Less details
The Payment Details report is the report shows details for payments created in a selected time period. Payments Details report is a fast report with time period selection up to one year, that will quickly give you details of your sales.
In the summary section of the report, you can see No. of transactions, Gross amount, Net amount, Tax amount for the selected period.
Using quick period time buttons you can quickly select the time period you are interested in. The period you selected will be highlighted in dark.
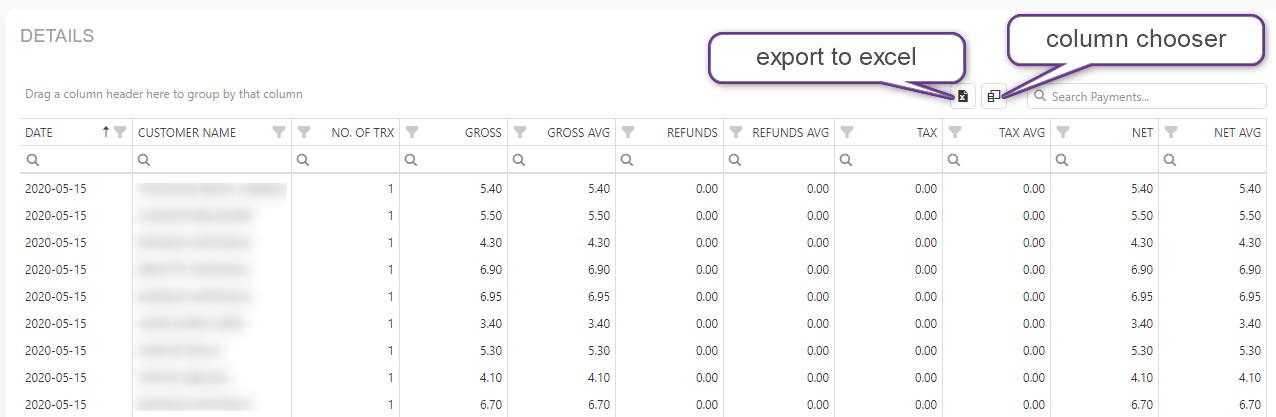
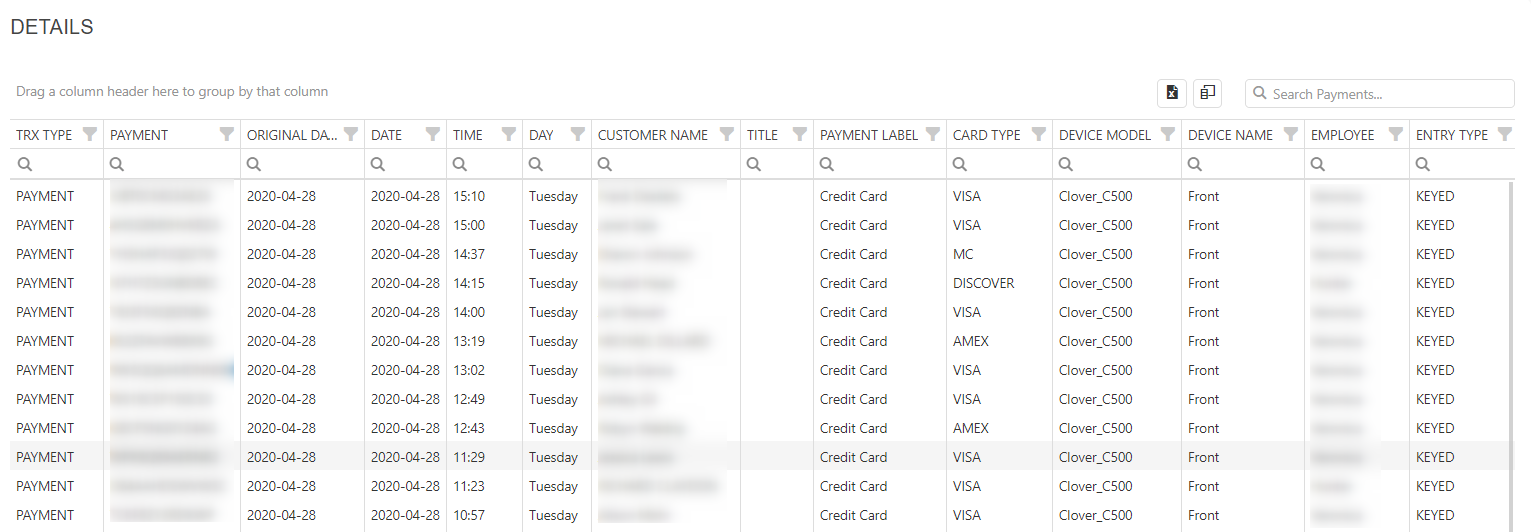
And at the bottom of the page, you can find the DETAILS table, where you are able to see more detailed information for the selected period in which you have the ability to remove/add columns from the table to specify which information you want to extract.
Quick video showing how to remove/add columns with Column Chooser:
https://businessq-software.com/wp-content/uploads/2017/06/cchoo.gif
If you need to export data to Excell, simply click on an Excell Icon which is located left of Column Chooser and all of the data from the table will be exported.
Payments per Customers
Payment per Customers report is the report that shows business information for payments created on the selected time period with a focus on Customers.
Report facts:
- Report is based on payments
- Very Fast Report
- Period selection up to 1 year
- Less details
In the summary section of the report, you can see No. of transactions, Gross amount, Net amount, Tax amount, etc. for the selected period.
Using quick period time buttons you can quickly select the time period you are interested in. The period you selected will be highlighted in dark.
In the graph section, you can see several graphs where information like Number of the transaction, Net, and Average net per customer is presented.
And at the bottom of the page, you can find the DETAILS table, where you are able to see more detailed information for the selected period in which you have the ability to remove/add columns from the table to specify which information you want to extract.
If you need to export data to Excell, simply click on an Excell Icon which is located left of Column Chooser and all of the data from the table will be exported.
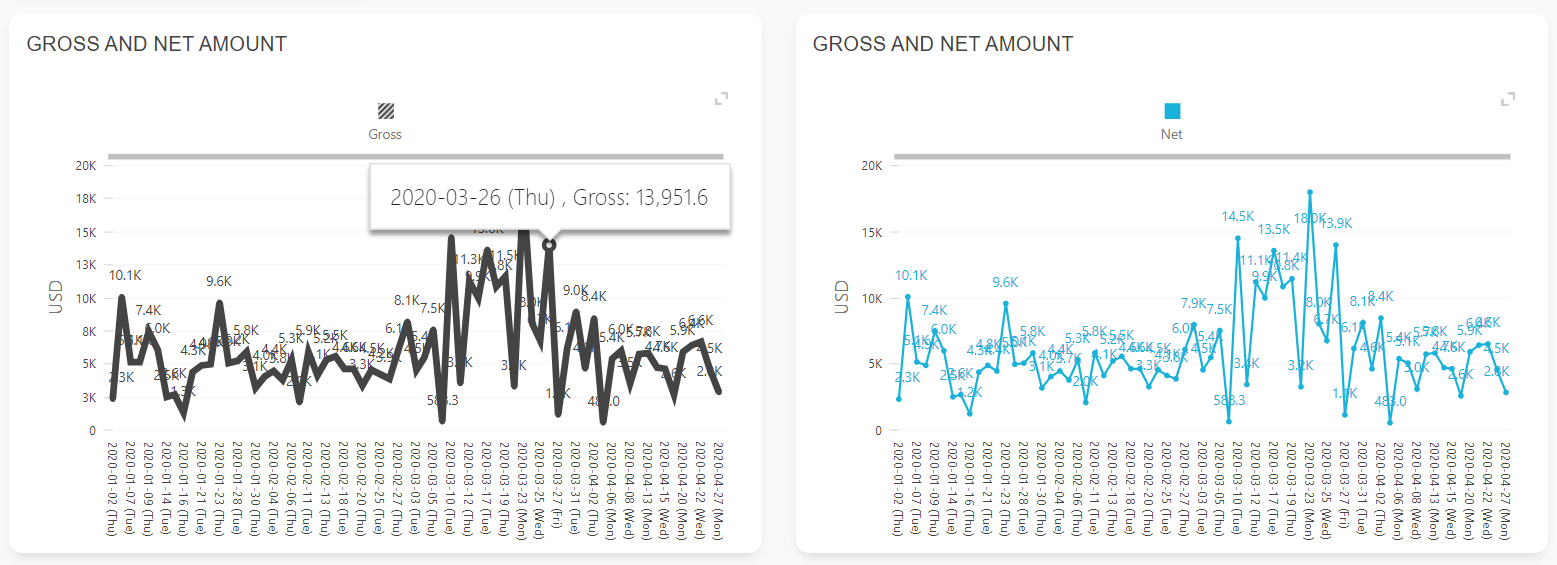
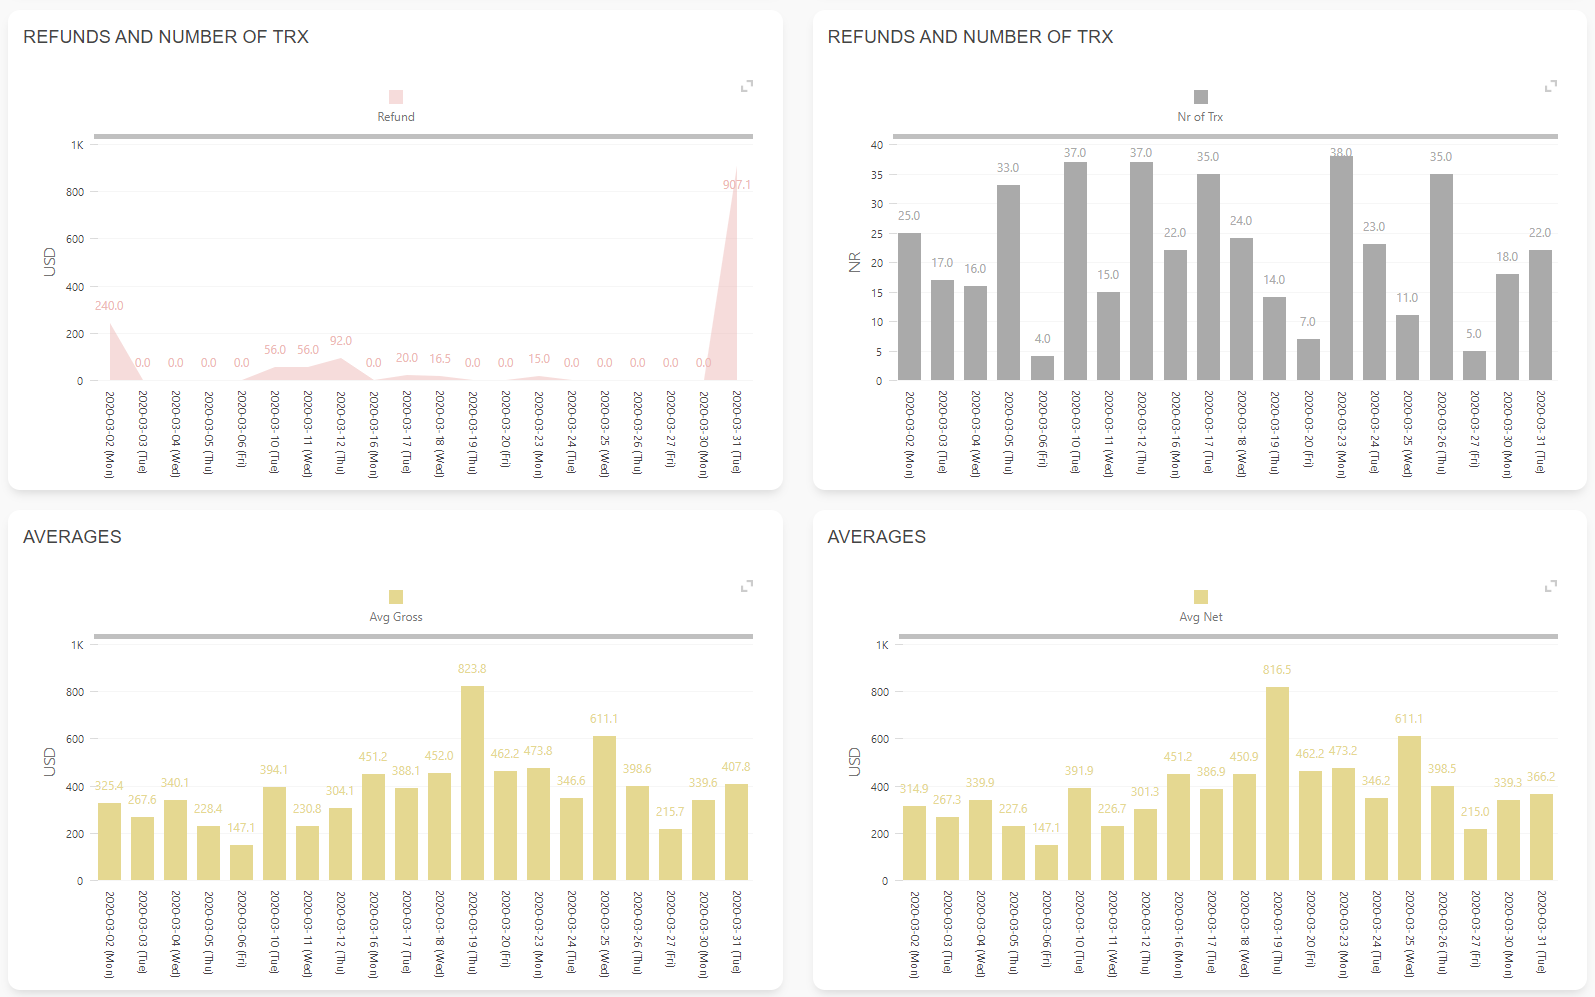
Payments Trends Analysis
Payments Trends Analysis Report is report that shows business information for payments created on the selected time period with a focus on trends and dates.
Report facts:
- Report is based on payments
- Very Fast Report
- Period selection up to 1 year
- Less details
In the summary section of the report, you can see information like the Number of transactions, Gross amount, Net amount, Tax amount, etc. for the selected period.
In the middle of the report, there are several graphs where you can see different information related to payment trends.
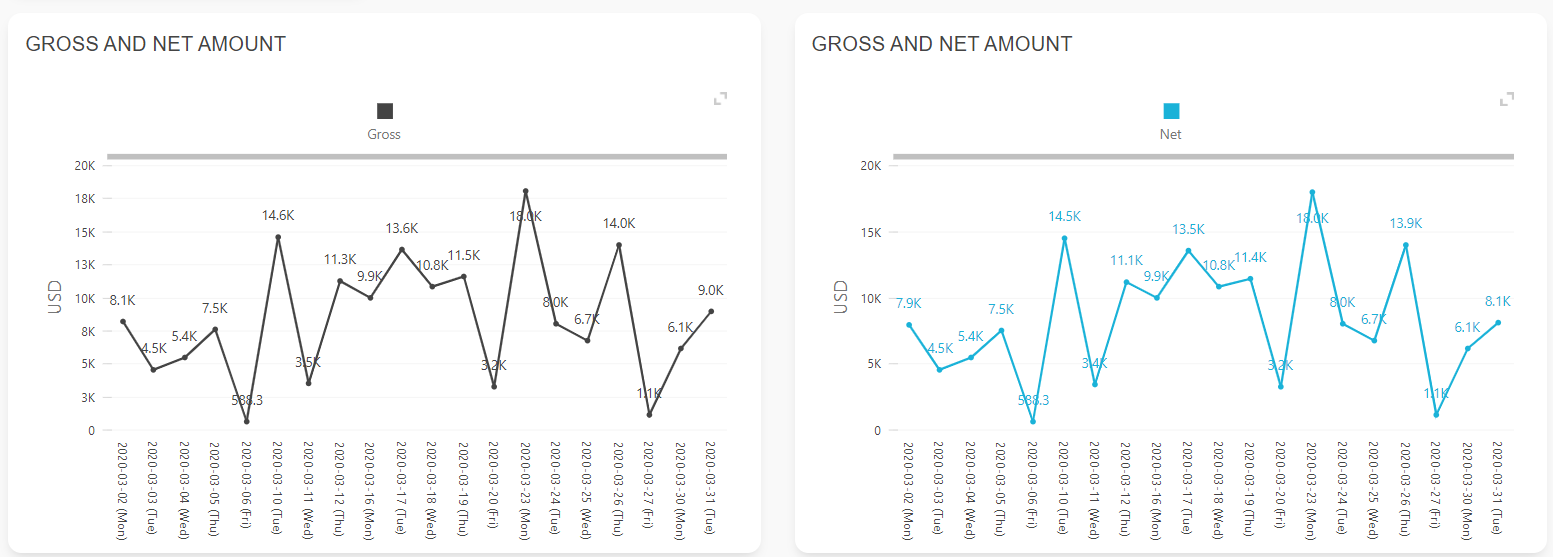
And at the bottom of the page, you can find the DETAILS table, where you are able to see more detailed information for the selected period in which you have the ability to remove/add columns from the table to specify which information you want to extract. If you need to export data to Excell, simply click on an Excell Icon which is located left of Column Chooser and all of the data from the table will be exported.
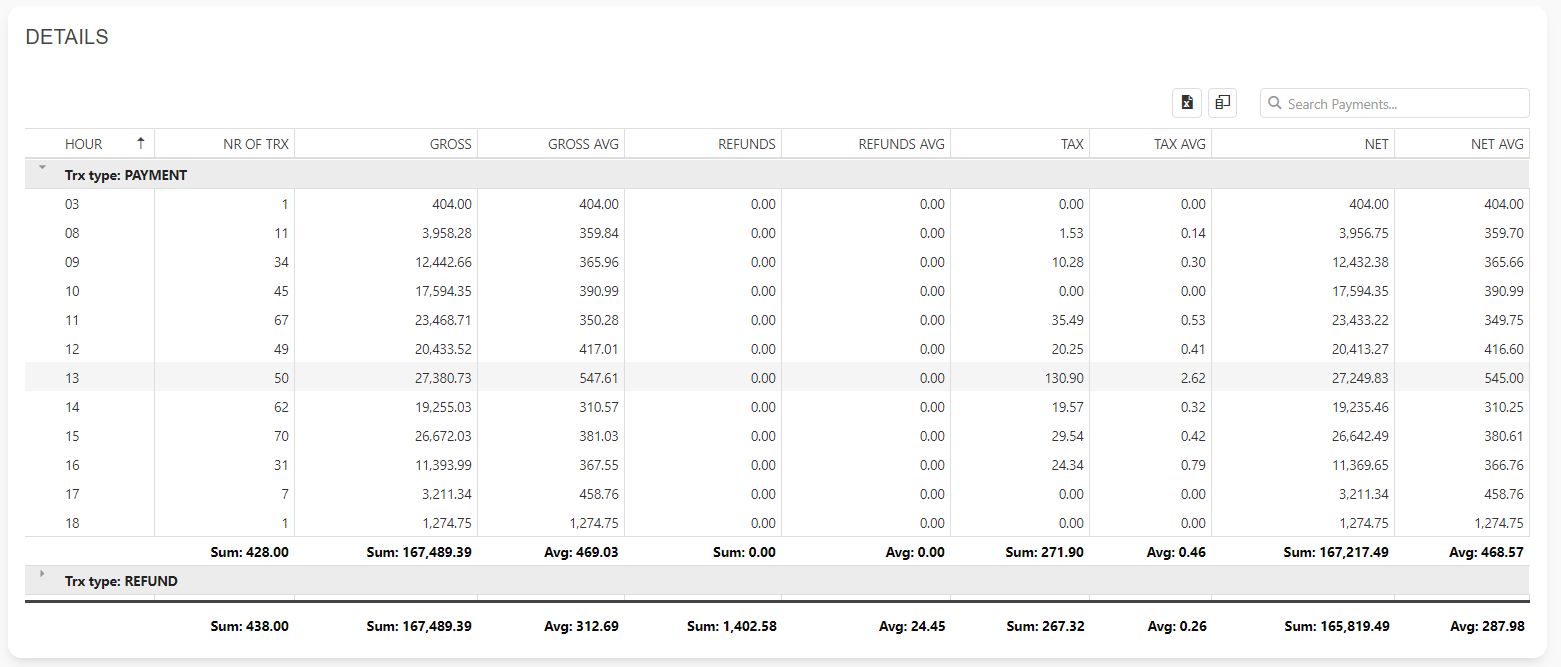
Payments per Hour
Payments per Hour report is the report that shows business information for payments created on the selected time period with a focus on hours in a day.
Report facts:
- Report is based on payments
- Very Fast Report
- Period selection up to 1 year
- Less details
In the summary section of the report, you can see No. of transactions, Gross amount, Net amount, Tax amount, etc. for the selected period. Using quick period time buttons you can quickly select the time period you are interested in. The period you selected will be highlighted in dark.
In the graph section, you can see several graphs where information like Number of the transaction, Net, and Average net for payments per hour.
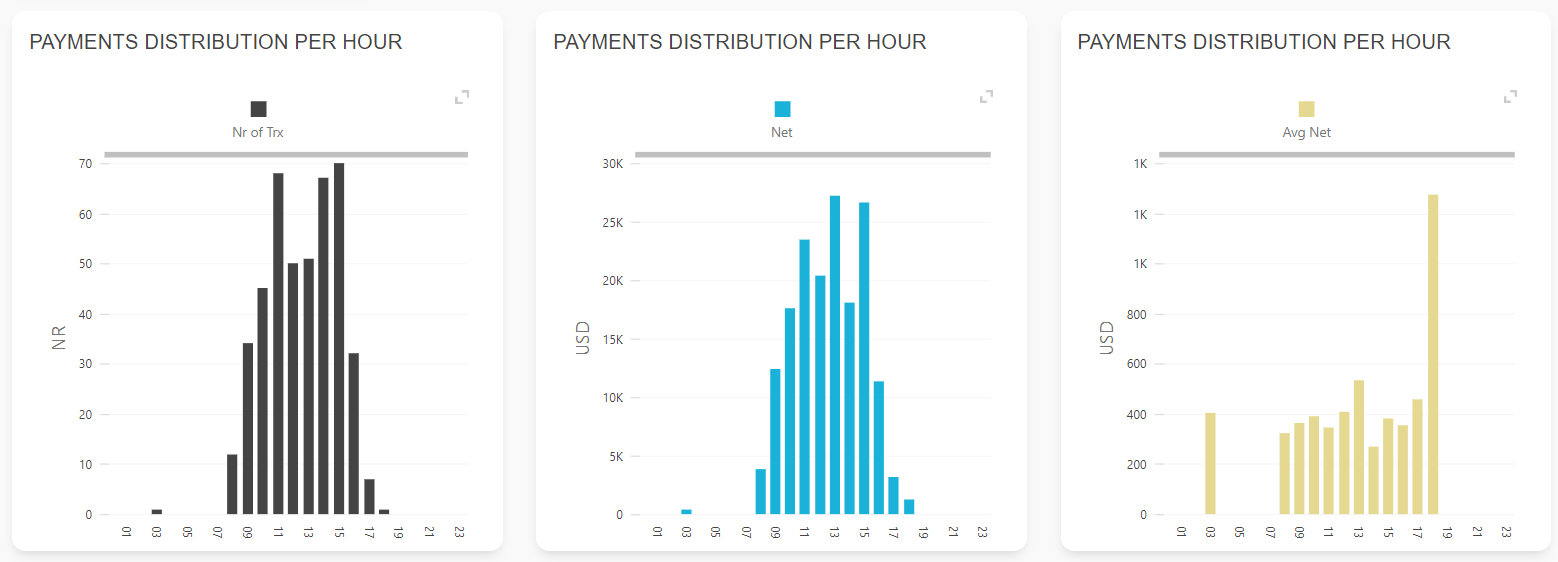
And at the bottom of the page, you can find the DETAILS table, where you are able to see more detailed information for the selected period in which you have the ability to remove/add columns from the table to specify which information you want to extract. If you need to export data to Excell, simply click on an Excell Icon which is located left of Column Chooser and all of the data from the table will be exported.
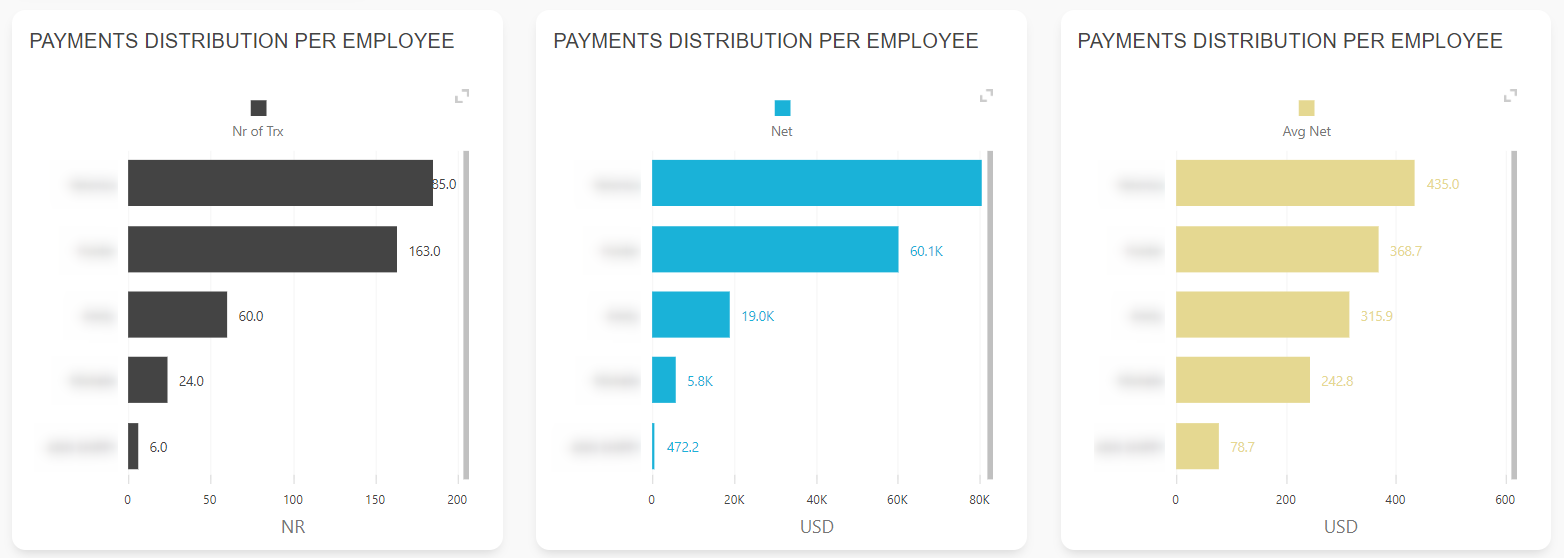
Payments per Employee
Payment per Employee report is the report that shows business information for payments created on the selected time period with a focus on Employees.
Report facts:
- Report is based on payments
- Very Fast Report
- Period selection up to 1 year
- Less details
In the summary section of the report, you can see No. of transactions, Gross amount, Net amount, Tax amount, etc. for the selected period. Using quick period time buttons you can quickly select the time period you are interested in. The period you selected will be highlighted in dark.
In the graph section, you can see several graphs where information like Number of the transaction, Net, and Average net per customer is presented.
And at the bottom of the page, you can find the DETAILS table, where you are able to see more detailed information for the selected period in which you have the ability to remove/add columns from the table to specify which information you want to extract.
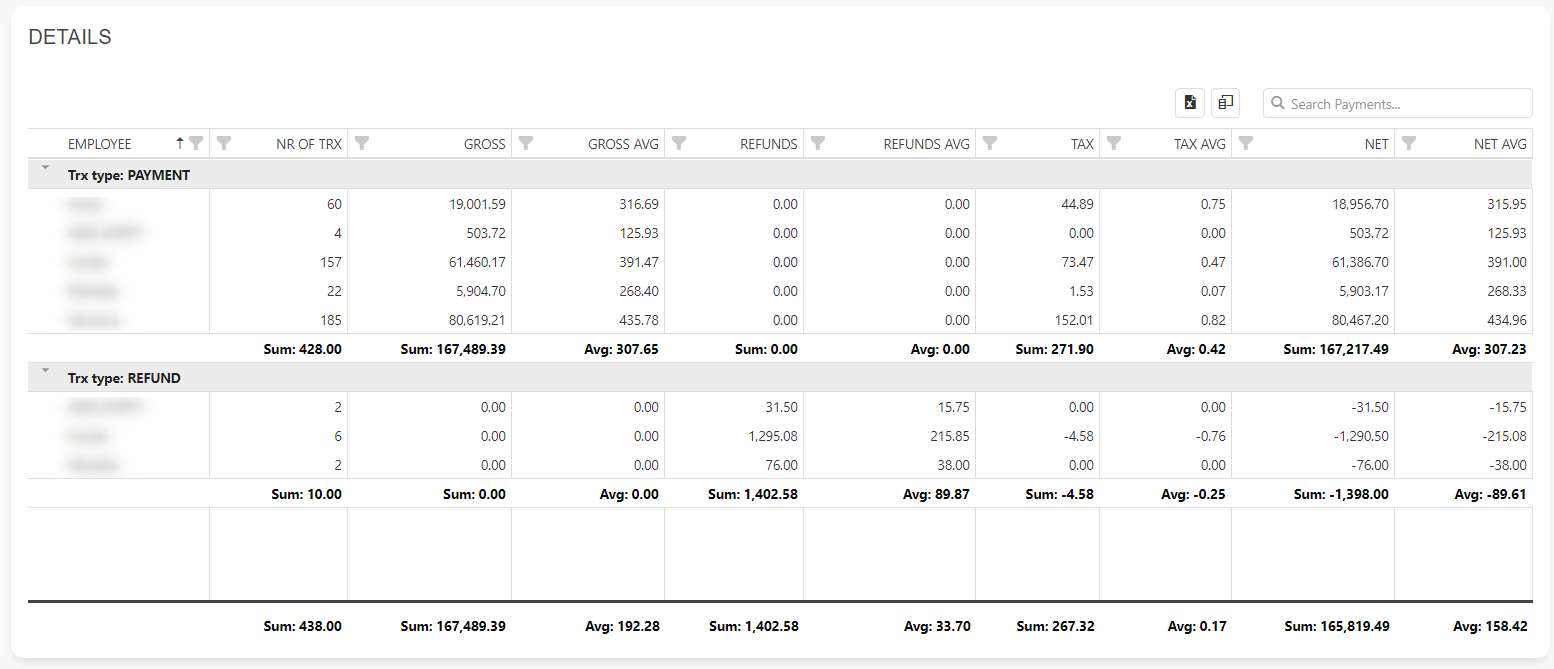
If you need to export data to Excell, simply click on an Excell Icon which is located left of Column Chooser and all of the data from the table will be exported.
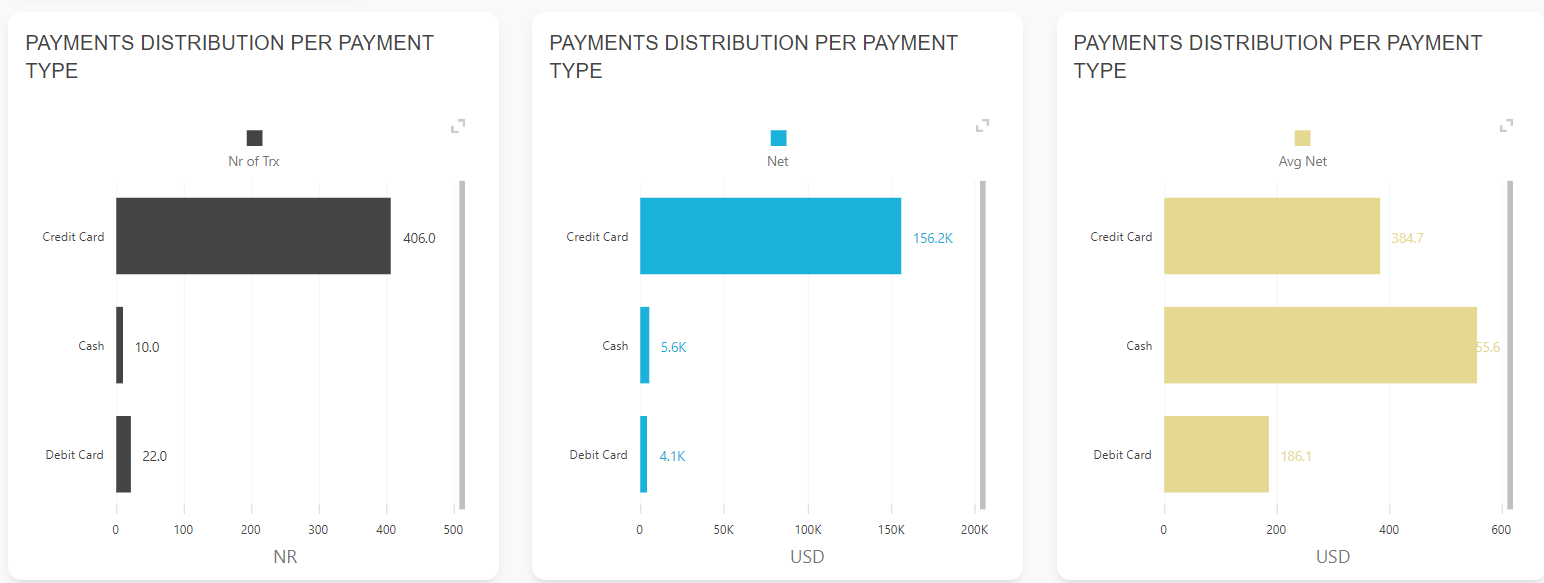
Payment Types (Tenders)
Payment types report is the report that shows business information for payments created on the selected time period with a focus on Payment type.
Report facts:
- Report is based on payments
- Very Fast Report
- Period selection up to 1 year
- Less details
In the summary section of the report, you can see No. of transactions, Gross amount, Net amount, Tax amount, etc. for the selected period. Using quick period time buttons you can quickly select the time period you are interested in. The period you selected will be highlighted in dark.
In the graph section, you can see several graphs where information like Number of the transaction, Net, and Average net per payment type.
And at the bottom of the page, you can find the DETAILS table, where you are able to see more detailed information for the selected period in which you have the ability to remove/add columns from the table to specify which information you want to extract.
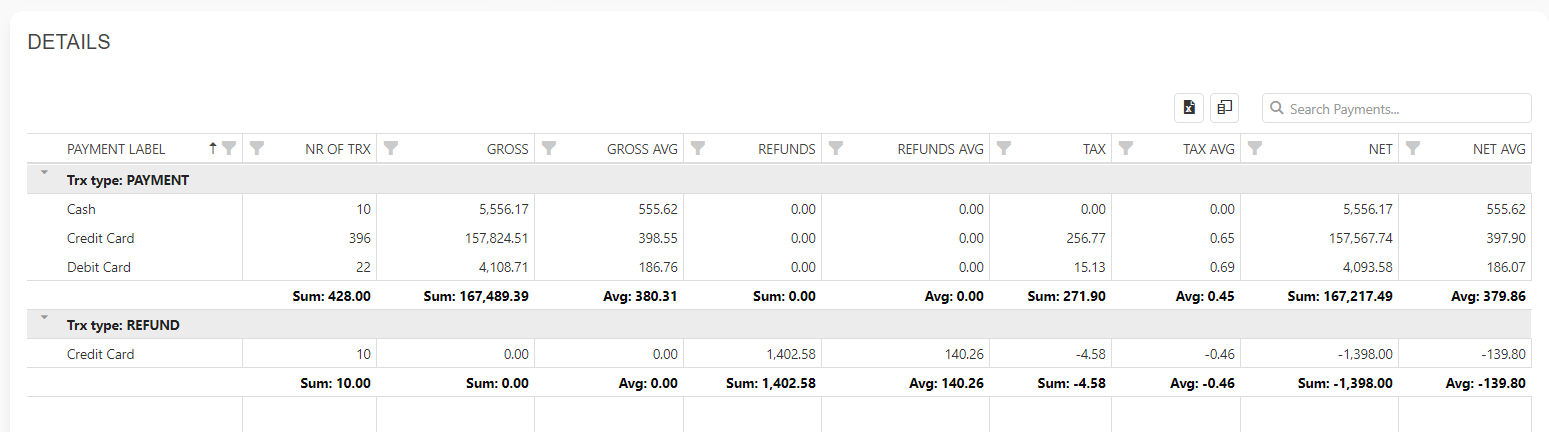
If you need to export data to Excell, simply click on an Excell Icon which is located left of Column Chooser and all of the data from the table will be exported.
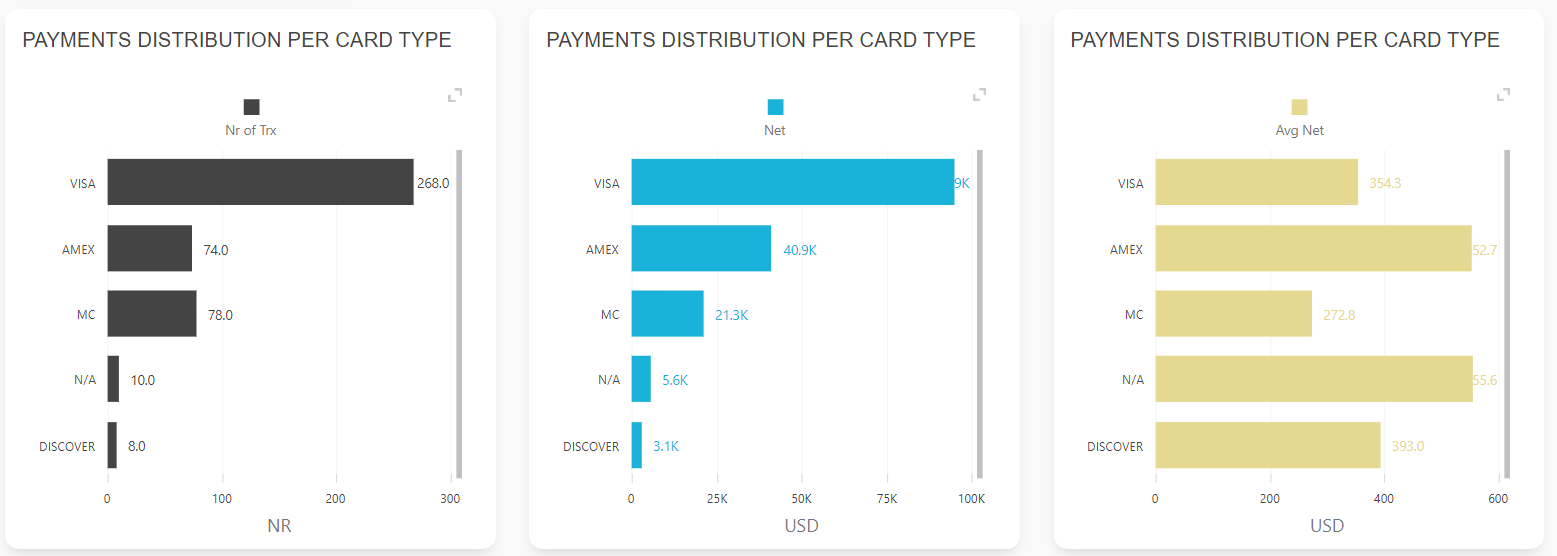
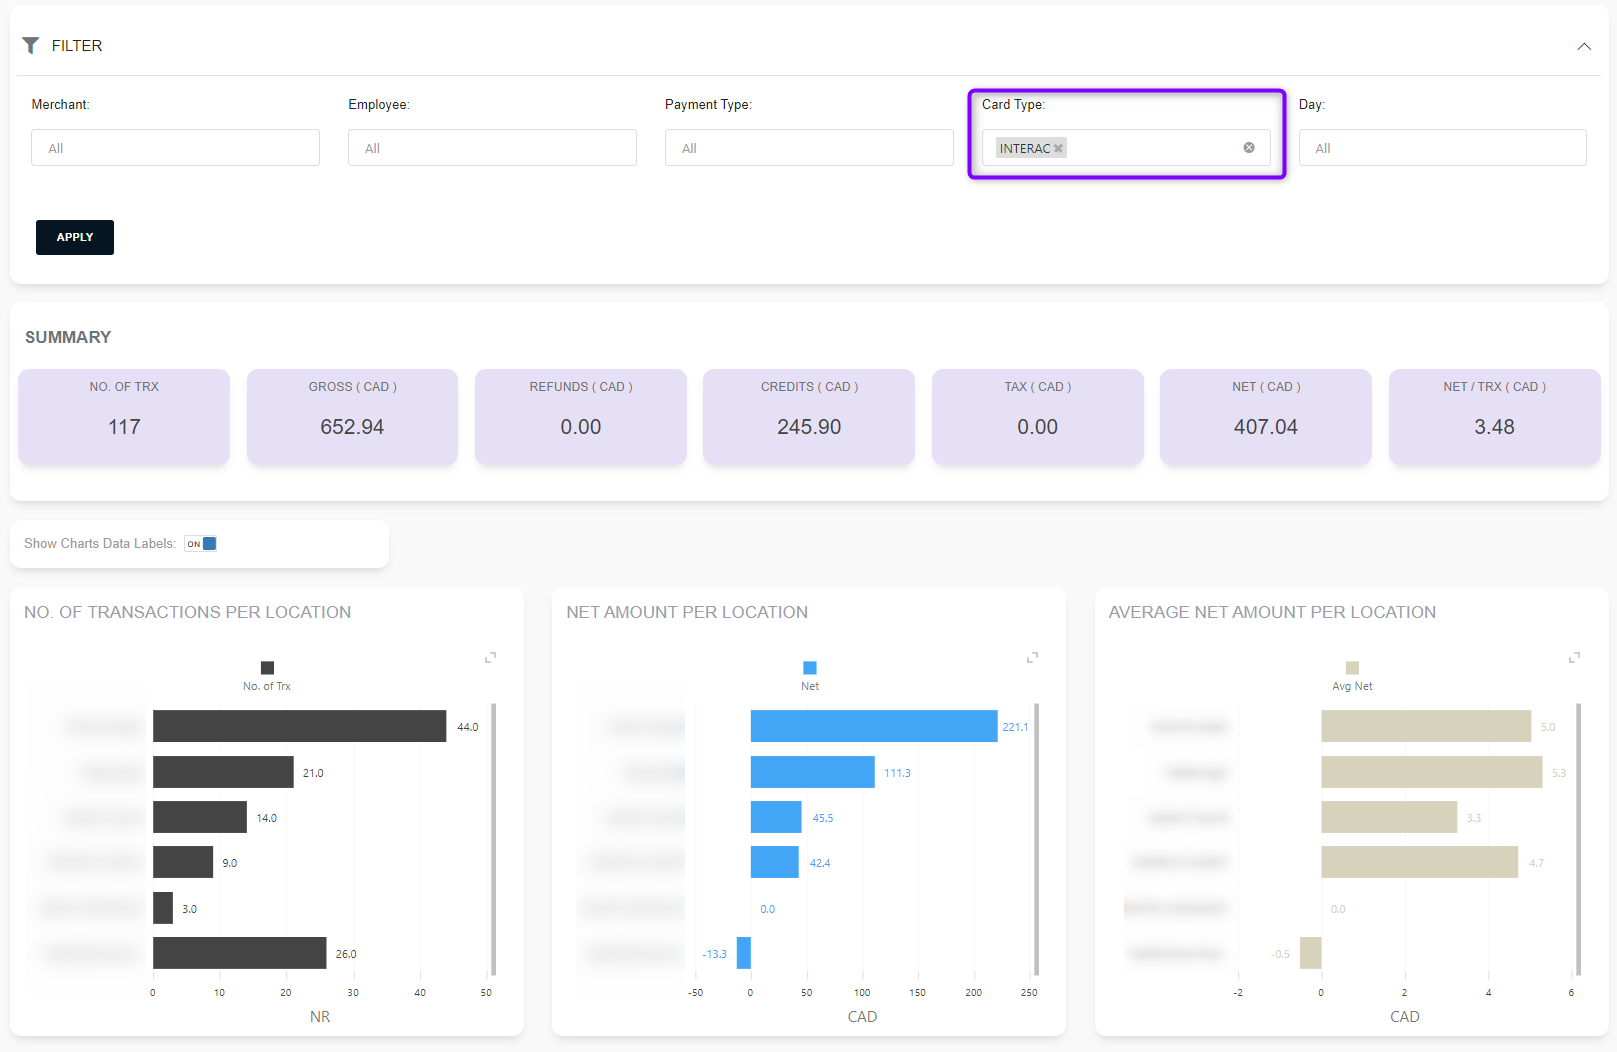
Payments per Card Type
Payment per Card Type report is the report that shows business information for payments created on the selected time period with a focus on Card Types.
Report facts:
- Report is based on payments
- Very Fast Report
- Period selection up to 1 year
- Less details
In the summary section of the report, you can see No. of transactions, Gross amount, Net amount, Tax amount, etc. for the selected period.
Using quick period time buttons you can quickly select the time period you are interested in. The period you selected will be highlighted in dark.
In the graph section, you can see several graphs where information like Number of the transaction, Net, and Average net per card type is presented.
And at the bottom of the page, you can find the DETAILS table, where you are able to see more detailed information for the selected period in which you have the ability to remove/add columns from the table to specify which information you want to extract.
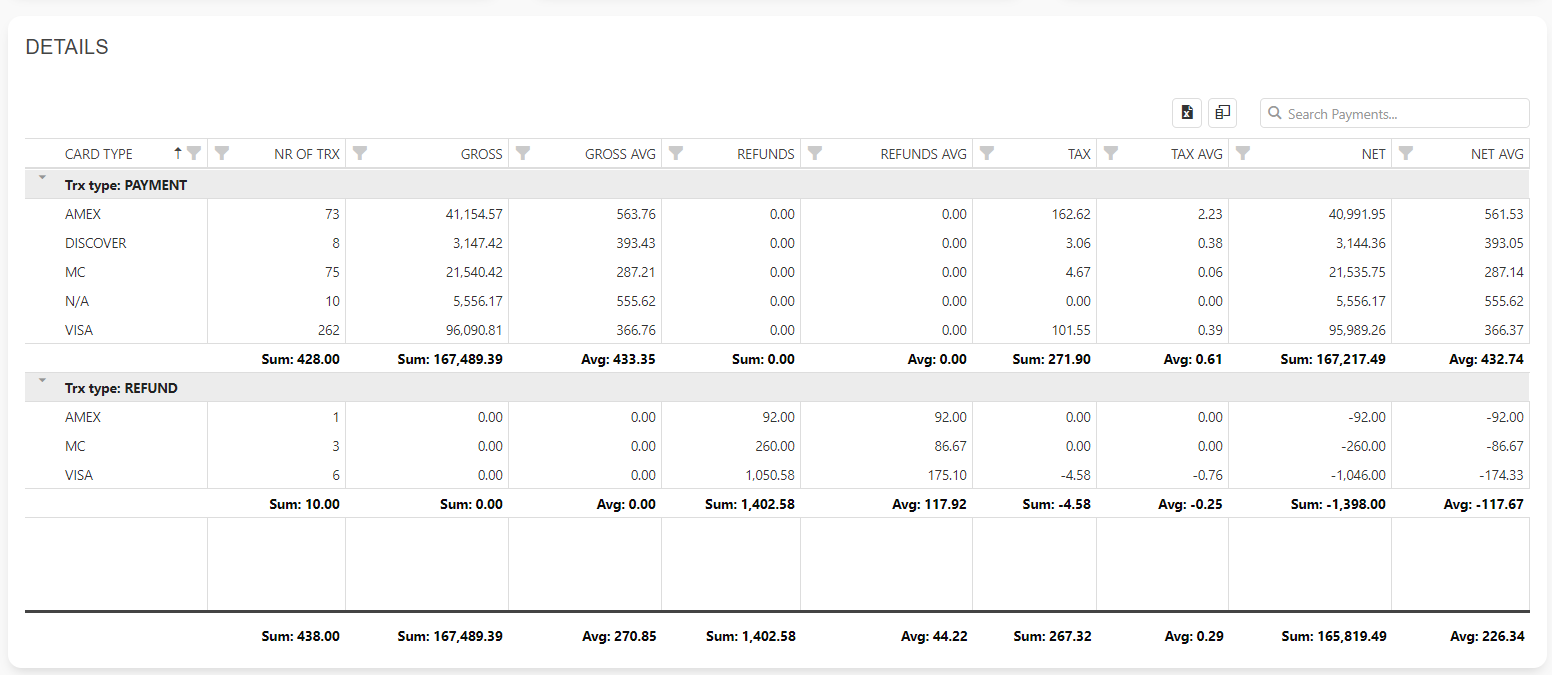
If you need to export data to Excell, simply click on an Excell Icon which is located left of Column Chooser and all of the data from the table will be exported.
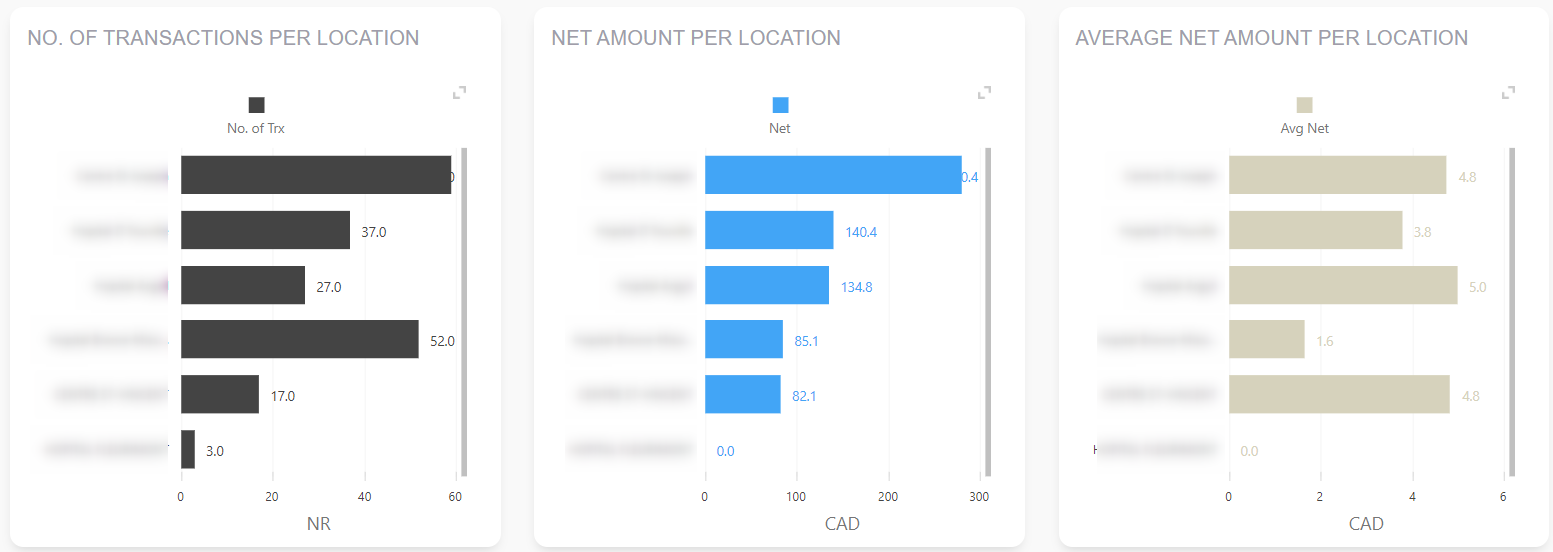
Payments: MULTI LOCATION
Payment Multi-location report is the report that shows business information for payments created on the selected time period with a focus on each location linked with the multi-location feature.
In the summary section of the report, you can see No. of transactions, Gross amount, Net amount, Tax amount, etc. for the selected period.
Using quick period time buttons you can quickly select the time period you are interested in. The period you selected will be highlighted in dark.
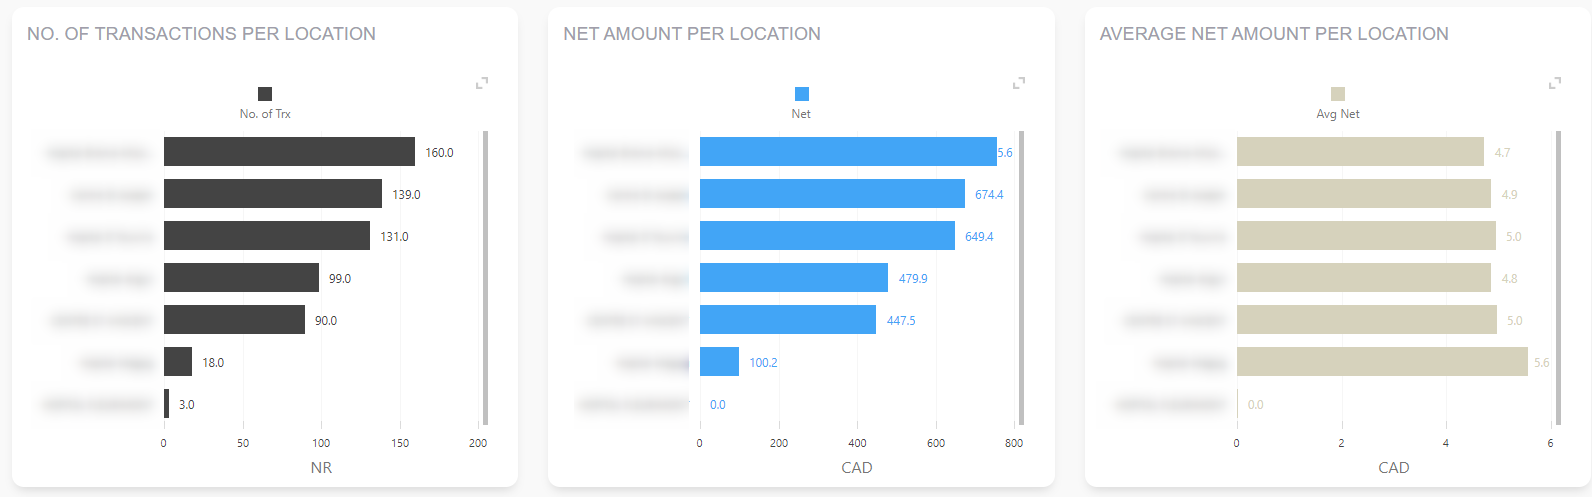
In the graph section, you can see several graphs where information like Number of the transaction, Net, and Average net per card type is presented. In these graphs, you will see this data for all linked locations.
And at the bottom of the page, you can find the DETAILS table, where you are able to see more detailed information for the selected period in which you have the ability to remove/add columns from the table to specify which information you want to extract.
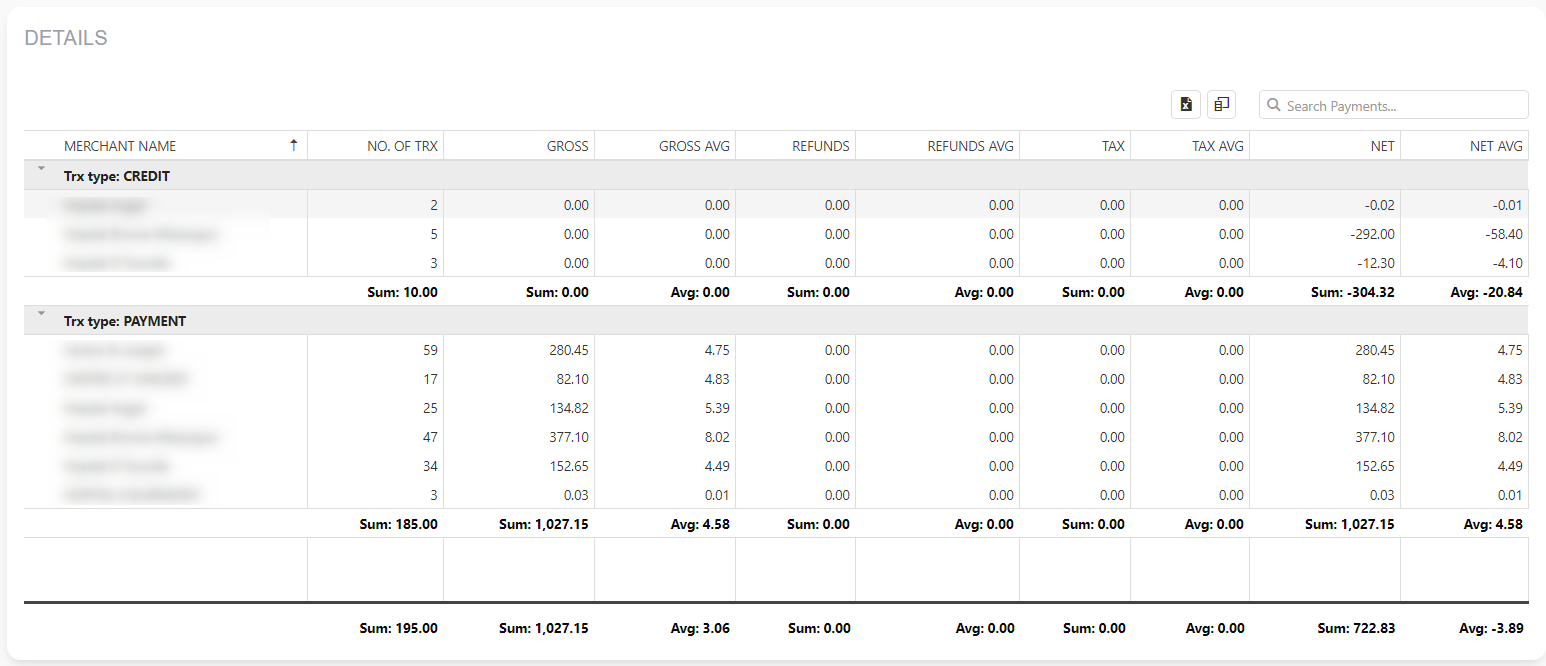
If you need to export data to Excell, simply click on an Excell Icon which is located left of Column Chooser and all of the data from the table will be exported.
Welcome Screen and its Settings
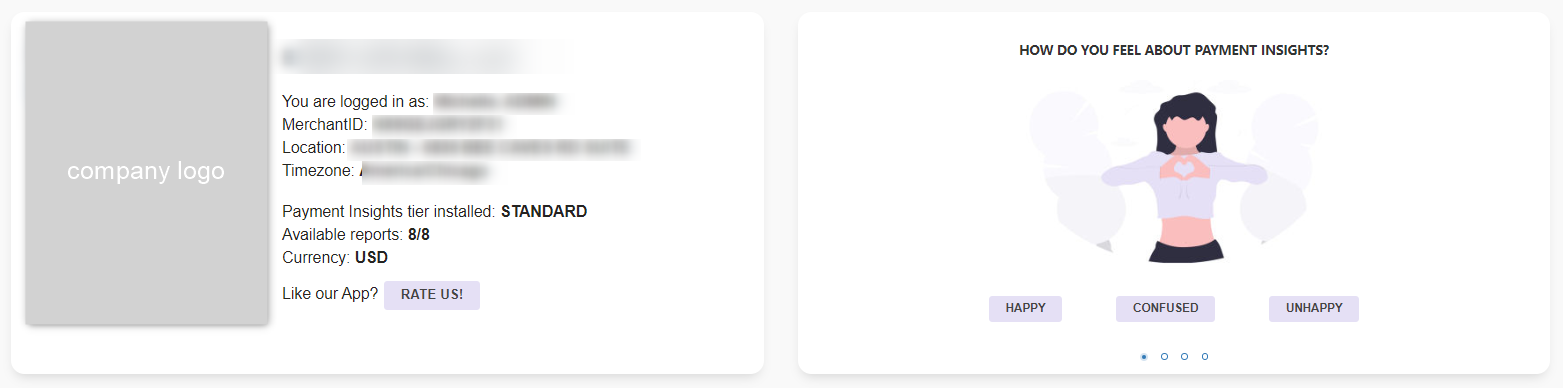
The Welcome Screen is the login landing page of the Payment Insights app. It can be accessed either by clicking on the Payment Insights logo or the Welcome icon in the main mane.
On the welcome screen, you get several pieces of information like
- Location Details
- Info carousel
- Recent Report Activity
Recent Report Activity
In the Recent Report Activity section, you will see all the reports recently used. The last used report will be first from the left. In this way, you can always see what you are using the most.
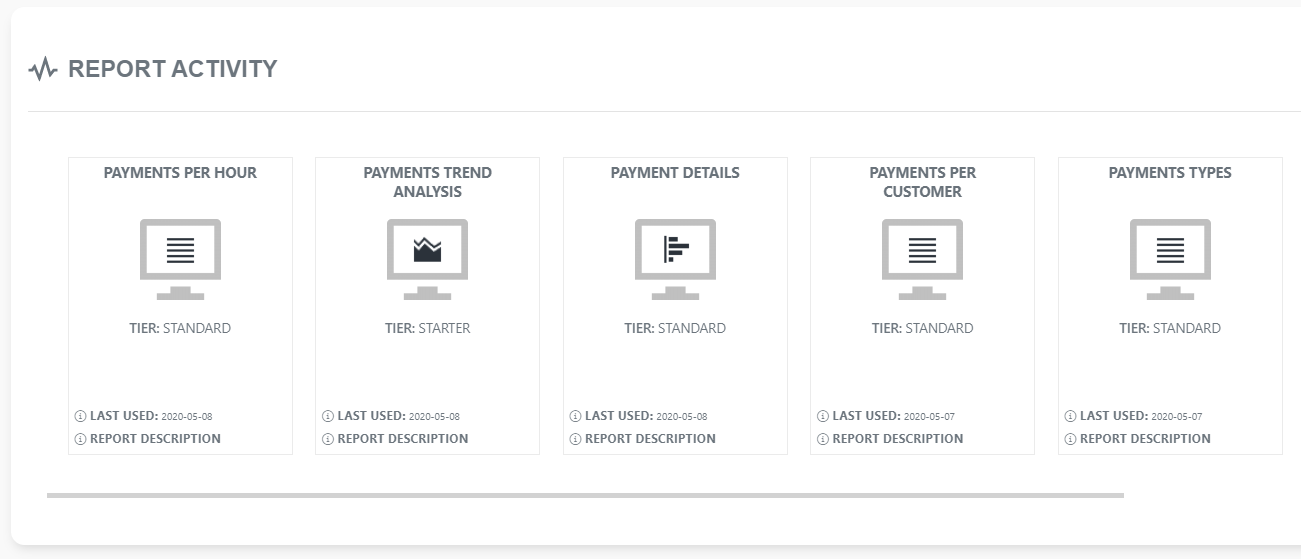
Note: Person logged in with a role that was unselected will not be able to access any of the reports, including settings pages.
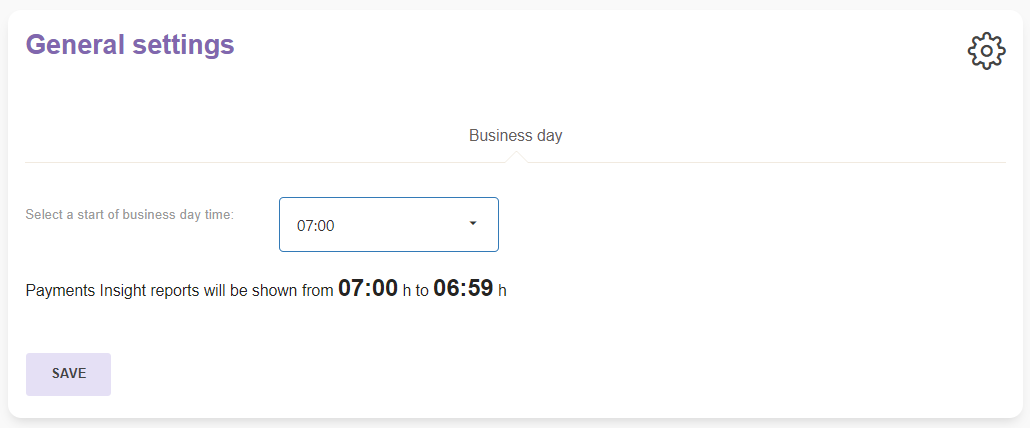
General Settings
GENERAL SETTINGS
You can find the General Settings within the Setup Screen. Here you can define several basic data that are connected to your business like:
- the start of a business day – here you can set an hour when your Business day starts. If you want Payment Insights to analyze your data differently than calendar day hours, define the start of a day as you need it. It can be an hour a day. Please note that in that case, your business day will finish in 24h. All changes are saved automatically.
Multilocation Feature
Information on the multilocation features as well linked location can be found in the “Multilocation” page in Menu. Here you will find all the necessary information’s about the Mulitlocatoin feature as well to send a request to the support team.
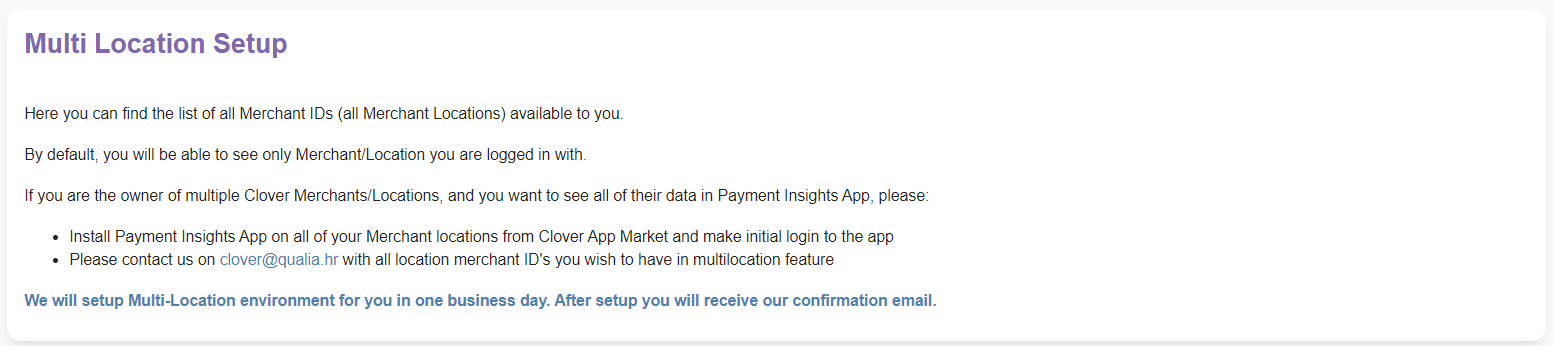
For an overview of all locations available to you in the Payment Insights App, go to the Multilocation page. At the bottom of the page, you will see a list of all linked locations. Here you can find the list of all Merchant IDs (all Merchant Locations) available to you at that moment.
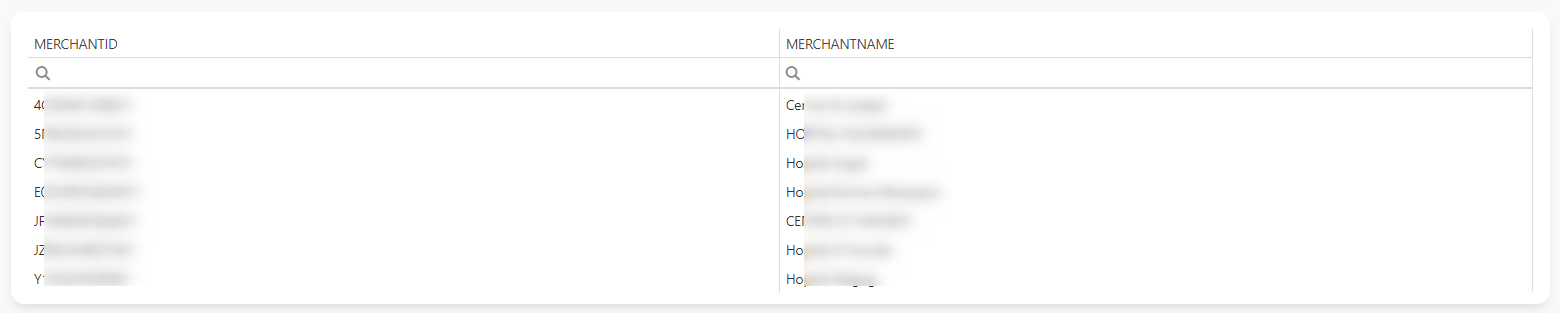
By default, you will be able to see only Merchant/Location you Log in with.
If you are the owner of multiple Clover Merchants/Locations, and you want to see all their data in Payment Insights App, please:
- Install at least STANDARD Tier on all your Merchants from Clover App Market and make initial login to Payment Insights App
We will setup the Multi-Location environment for you in one business day. After the multilocation feature is installed you will receive our confirmation email.
- Please contact us on ‘clover@qualia.hr’ with multi-merchant setup request
- Send us Merchant IDs of locations you want to have a Multilocation feature.
What will you get with it?
On every Payment Insights Report you will see a Merchant filter:
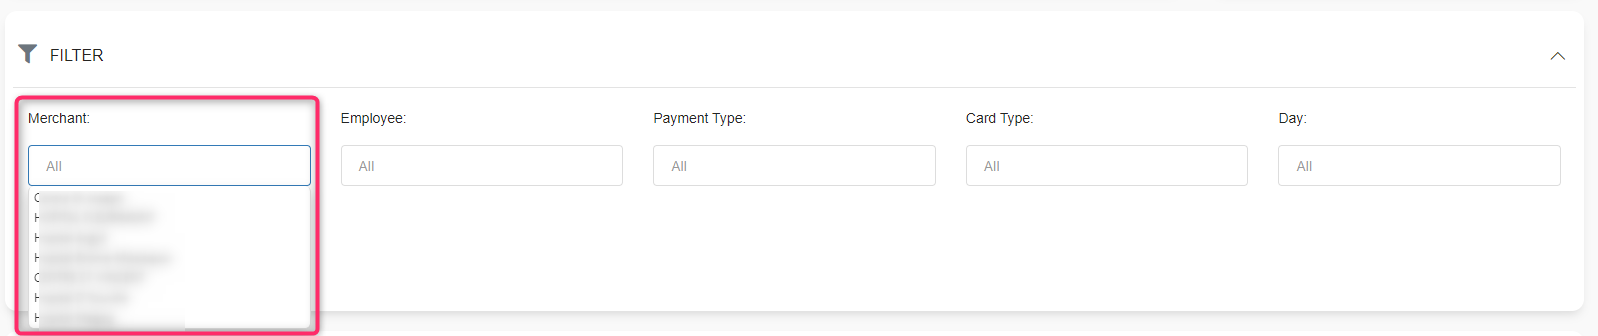
That means – you can filter all your reports (Customers, Employees, Hours, etc,.. ) for one or more your Merchants/Locations!
Multi-Location Report
On our Multi-Location Report you will be able to see and compare (visually and in a table) revenues, the number of orders, averages, and more from all your locations.
We hope you will find this new feature very useful. It should give you a great overview of your growing business.
To set up a multi-location feature of your choosing, just sent us an email at clover@qualia.hr altogether with all relevant ID’s (employees ID’s or merchant ID’s).
Commisions
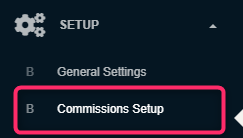
If you pay to at least some of your employees via commission, you can now use Payment Insights for Clover to adjust commission types and percentages. You can find the commissions menu under page Setup.
Commission Type can be
- Fixed percentage or
- Scaling percentage
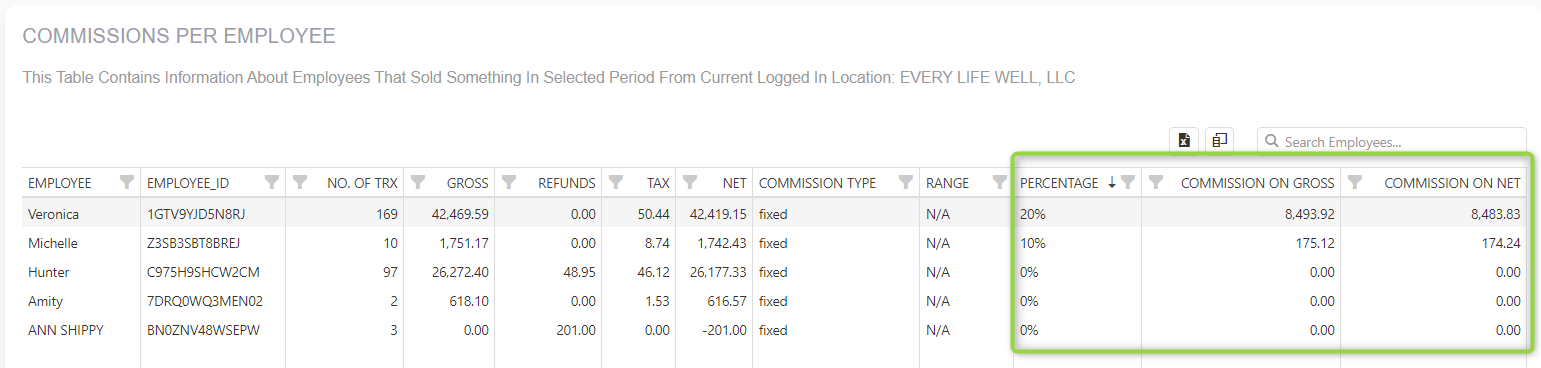
Employees’ commissions can be seen in the “Payment per Employee” report.
Commissions percentages are calculated from the Gross Amount.
Fixed & scaled commissions
How to use this form
If you check „APPLY COMMISSIONS“ checkbox
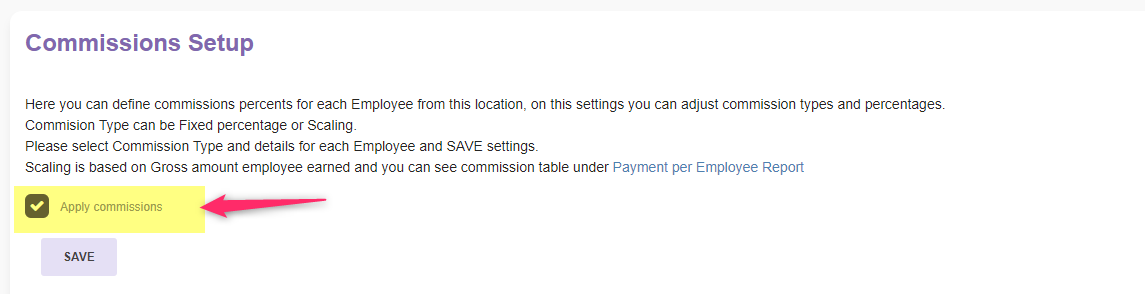
When you check the „APPLY COMMISSIONS“ checkbox you will get a list of all your employees, with commission type for every employee. There are two types of commissions, fixed and scaling. By default, all commission type is set to „fixed“.
By clicking on each employee name you will be able to manage commissions settings for the selected employees.
First, you select commission type:
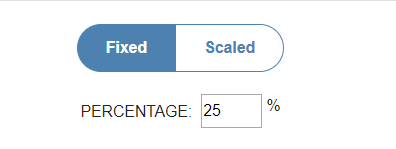
1. Fixed is selected
By selecting „Fixed “, the commission will always be calculated with the same percentage. For each employee, the commission is defined separately. To define commissions, go through the employee list, and define each commission.
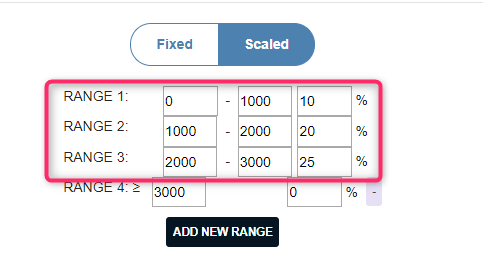
2. Scaling is selected
Now you can set ranges. By default, there are two ranges but you can add more ranges by clicking on the „New Range“ button. The Commission will be calculated based on a range. There are two values in every range, “from” and “to”.
If you set
Range 1 : 0 – 1000 10% ,
this means that if an employee sold gross sales from $0 – $999, a 10% commission percentage will be used.
The changes that you made have no effect until you save changes by clicking on the „Save“ button on the top/bottom of the page.

Where can I see commissions?
If you check „APPLY COMMISSIONS“ checkbox, you will see some new commission tables on
- “Payment per Employee” report
Frequently Asked Questions / Troubleshooting
In the next sections, we will gather frequently asked questions we receive at our support email address.
If those questions/answers didn’t have solution to your problem, please send us an email with your question to clover@qualia.hr
CSV Export of selected data
Every report in the Payment Insights app has the ability to export a report on an entire payment level into a CSV file. In a option box you can find the respective export buttons next to the period selection box.
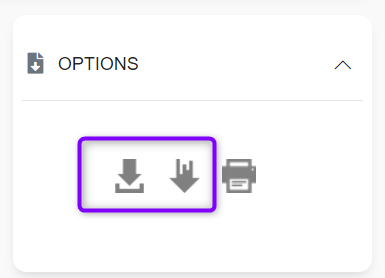
In each of the reports, there is the Options section where you can choose between two export options:
- export current selected data (csv)
- export filtered data (csv)
The downloaded file will contain data from the period that was selected in the Analyzing period.
The following information is available to order based export:
Merchant Name, MerchantID, Transaction Type, Date, Original Date, Day, Hour, Time, Employee, Payment Type, Payment Date, Payment Time, Card Type, Payment customer, Payment title, Payment Label, Card Type, result amount, Tip Amount, Refund amount, Tax Amount, Refund tax amount, Tax Total, Net, etc.
Multi location support
I have more than one Merchant ID (location) in Clover. Does Payment Insights App support that?
Yes. If you have more merchant locations, they all can be integrated into our multi-location environment.
How to setup a Multi-location feature?
- Each location you want to integrate into a multi-location environment must be on STANDARD tier
- Log in at least once with each of your locations (initial login) to Payment Insights App
- Send us an e-mail at clover@qualia.hr with your merchant IDs for each location
- We will send you an e-mail confirmation (usually within 1-2 business days)
I have the FREE Tier. Why don’t I see some report filters?
In the STARTER (free) tier, you have the following Reports: Payment Trends Analysis and Payments per Card Type report.
Get STANDARD Tier to avoid any limitations and to get additional reports and dashboards. With Standard Tier, you will have the opportunity to have 8 reports at your disposal.
From how long ago can I see data in Payment Insights?
You can track data from the first day you started using Clover, regardless of when you installed the Payment Insights App. For example, if you started using Clover a year ago, and you installed the Payment Insights app last week, you will be able to analyze data from a year ago.
My browser doesn’t show new Payment Insights App version?
Sometimes web browsers cache “old” data and this disables you from seeing the newest features or improvements.
Steps that should force the browser to get the latest update:
- Try refreshing the Payment Insights page a few times or close your browser.
- Clear browser cache
- Open Payment Insights in a different browser
How to set up Employees Commissions?
You can find the Commission settings within the Setup page in the main menu.
Details about what types of commissions we support, on which reports can you see Commissions and how to properly adjust them are explained on this link.
Additional Filters on reports
Payment Insights reports can be multi-dimensionally filtered, and for every filter, you can select one or more values.
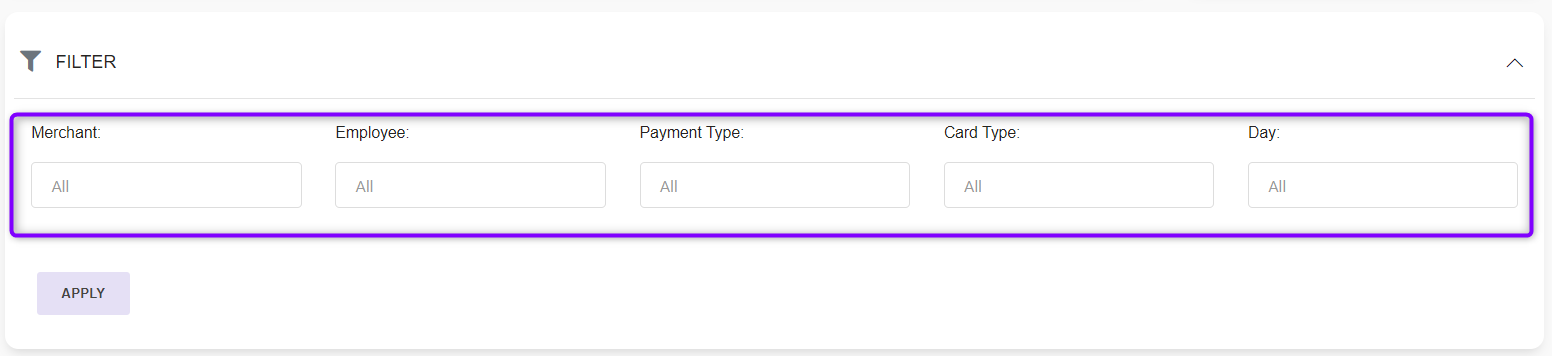
Additional filters are
- MERCHANT
- EMPLOYEE
- PAYMENT TYPE
- CARD TYPE
- DAY
For every filter, you can select one or more values.
Advanced Analysis
So, where is the beauty in this feature?
Consider Revenue Trends report. So far, it gave you all kinds of information connected to revenue per date. You can clearly see a net revenue trend chart, for example.
But what if you wish to see all those charts and all that info, but only for one of your devices? You just have to select that device in the additional filter:
All charts and tables will smoothly filter to new values!
Further, if you want to analyze all that info, just select what you need. As you can see, only your imagination and business need is a limit on what you want to filter and analyze (just one of the ideas – try to select 1 month of data, select only Monday and Friday in DAY filter and you will see an immediate comparison between those two days.)
Which customers buys the most?
If you want to know which customers are buying most often or which customer spent the most, then Payments per Customer report is all that you need.
You can check detailed explanations on this link here
Can I make a custom table and export it in that shape to the Excel?
Yes, all our tables are fully customizable, and by exporting them to Excel they are preserved.
To answer this question we created a short video of tips&tricks made for our other application Analytics App for Clover. That video you can check out here
Where can I get Payment Insights App for my mobile?
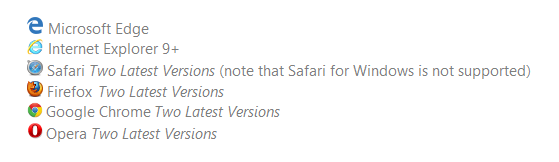
Payment Insights app for Clover is web application developed in the most modern web application framework. It is designed to work well on any device, including desktops, tablets, and mobile devices.
Supported web browsers are:
Is it possible to export graph?
No, it is not possible to export graphs.