Whether the type of business you are in, customers are your backbone. Without customers, no…
Analytics App – Revenue Trends
Hi, everyone!
In today’s blog entry for our Analytics App for Clover, we are explaining the usefulness of Revenue Trends report.
This report shows Trends and Dates information from Orders created in the selected time period.
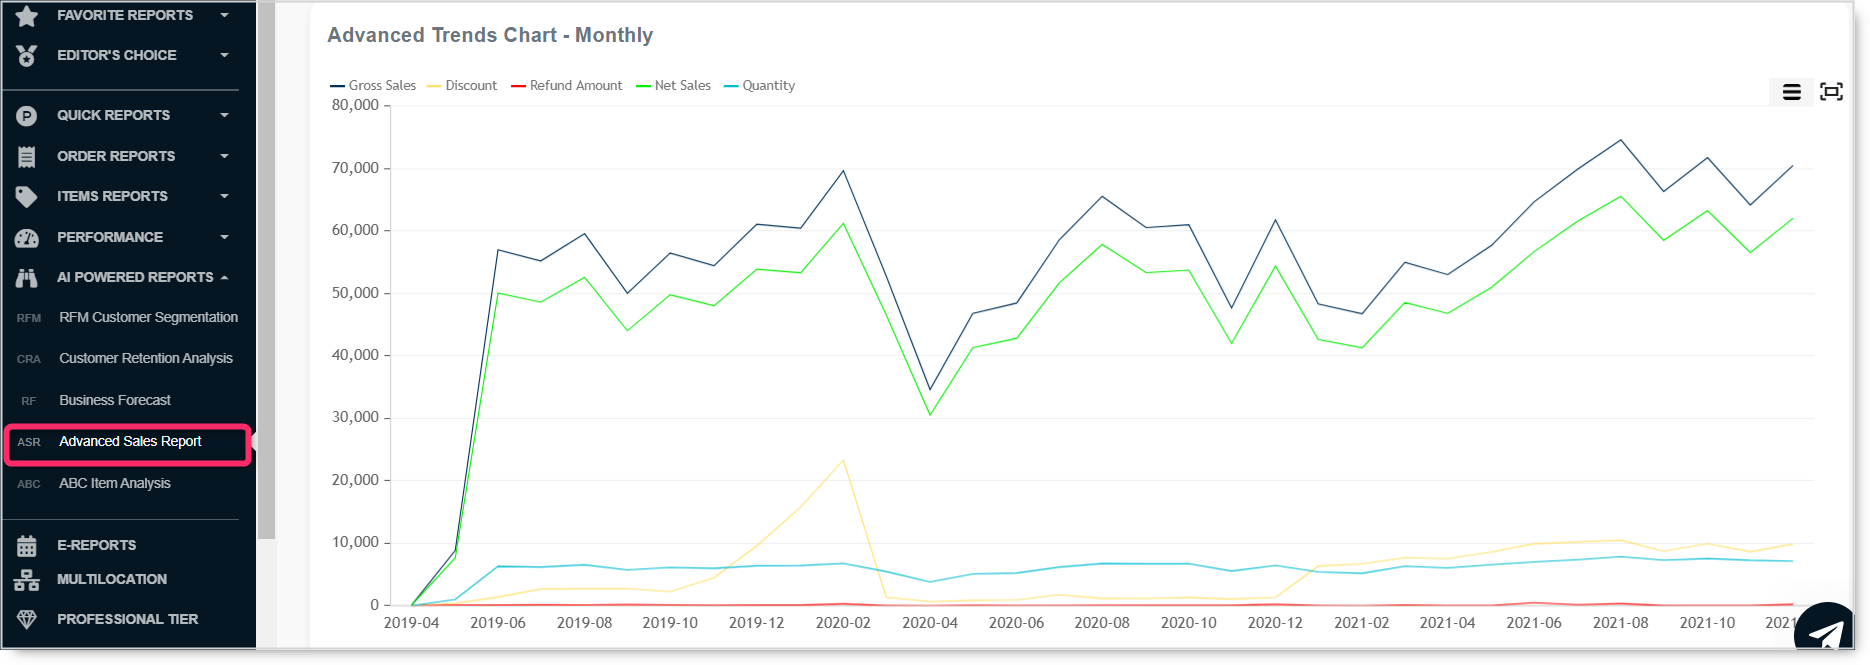
You can access this report as shown in the picture below:

Once you open this report and select a desired period of time you wish to analyze, the first thing you will see is a summary showing you important information like how many orders were in the selected period of time, refunds amount, Gross / Net and Tax amounts:

After a brief summary, three charts will appear offering you different information.
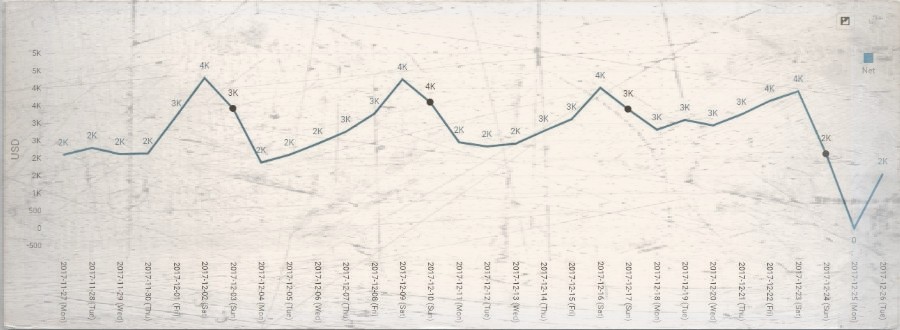
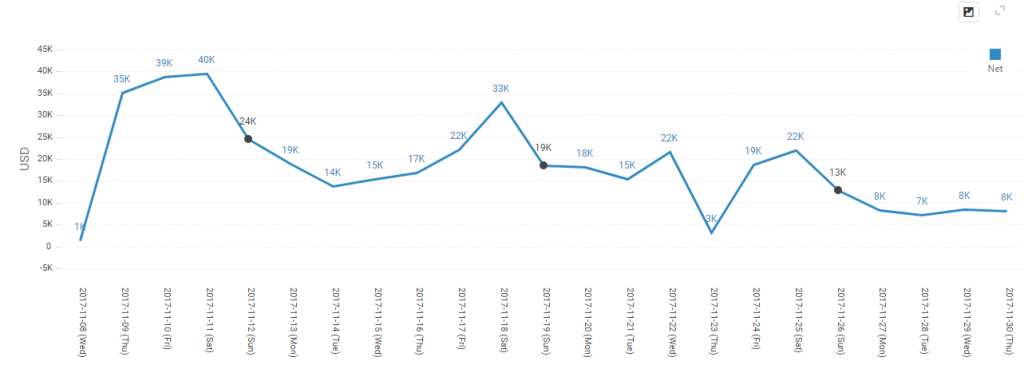
The first linear chart is offering you daily NET, where you can easily spot which days are best days for business, in our case below we can see that Friday and Saturdays are best days in a selected period of time. On this linear chart, you can see the beginning of the week (Sunday) as black dot. That dot will help you to fast track week-to-week dynamics of your sales data.
The second chart is showing you the number of orders per day in the selected period of time.
On each chart, you can hover with your mouse pointer over specific dots/bars for more information. Each chart can be easily exported to one of the available file types (PNG, JPG, PDF, SVG..).

And the last chart will present you with orders average Net payment:

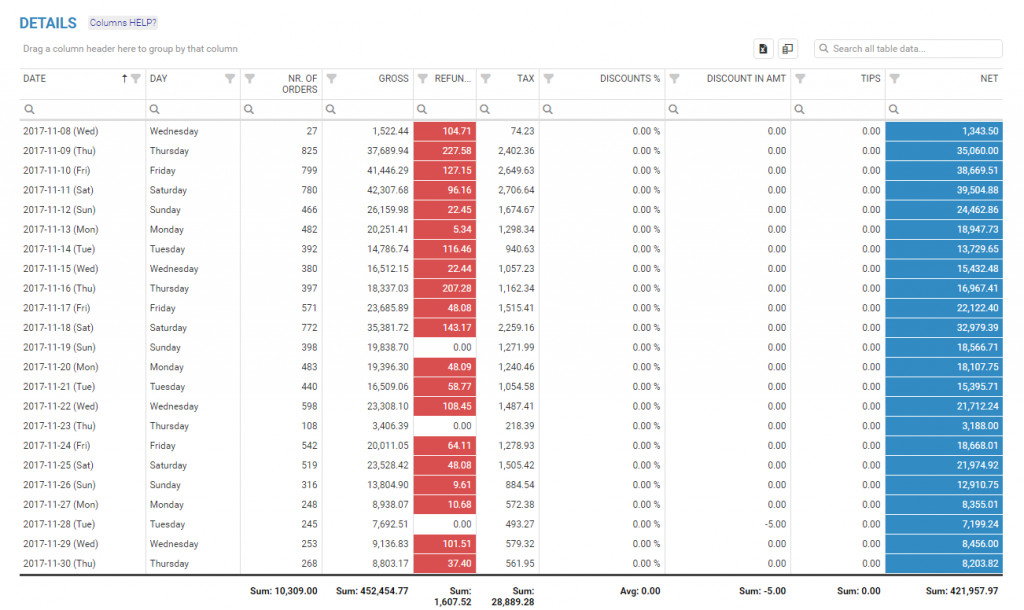
After charts, you will see a detailed table showing you lots of different information:
This table can be arranged the way you want moving/positioning columns by drag&dropping them where you wish them to be, surplus columns you think are not relevant can be easily removed from the table by dragging them back to column chooser. This way you can export table with the only information you want.Exports are super easy, all you have to do is to click on a button ‘Export all data’ above table and the table with its style you defined and data in it will be transformed in Excel file downloaded on your computer and ready to use!
We hope that you will find this report useful and if you have any questions, please do not hesitate to ask
Happy Analyzing!
Your Analytics for Clover Team

