Whether the type of business you are in, customers are your backbone. Without customers, no…
Analytics App – Revenue per Customer
Hi, everyone!
In today’s blog entry for our Analytics App for Clover, we are explaining the usefulness of Revenue per Customer report.
In short, this report is offering you overview of your customers in the selected period of time. If companies spent less time on advertising and more on customer service experience they would see better results in a long run. In this report, you will be able to spot best customers and maybe stimulate them with special discounts to make them feel appreciated. And they will definitely reward you by advertising your company for the way you treated them.
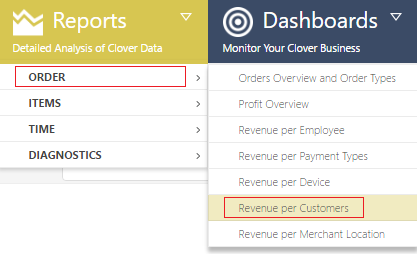
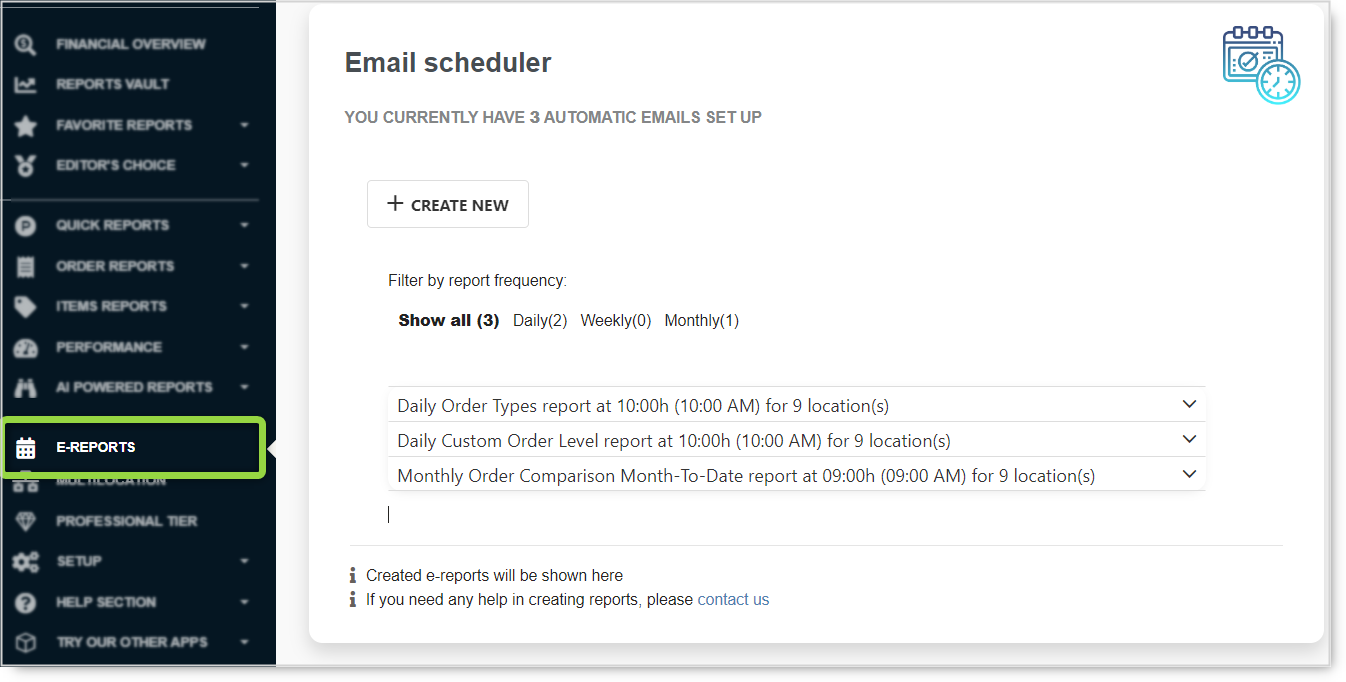
The report can be accessed from the menu as shown in the picture below:
Report facts:
- Report is based on Orders
- Slower load of a Report (provides more details)
- Period selection up to 62 days
- Very detailed reports
Like each of our reports this one has Summary which shows you a number of customers in the selected period of time as well as Gross/Refunds/Credits/Tax and NET values:

After summary you will have four charts available, you can very easily see which customers are buying the most often in the selected period of time.(Nr of Trx),
which customer spent the most ( Net )
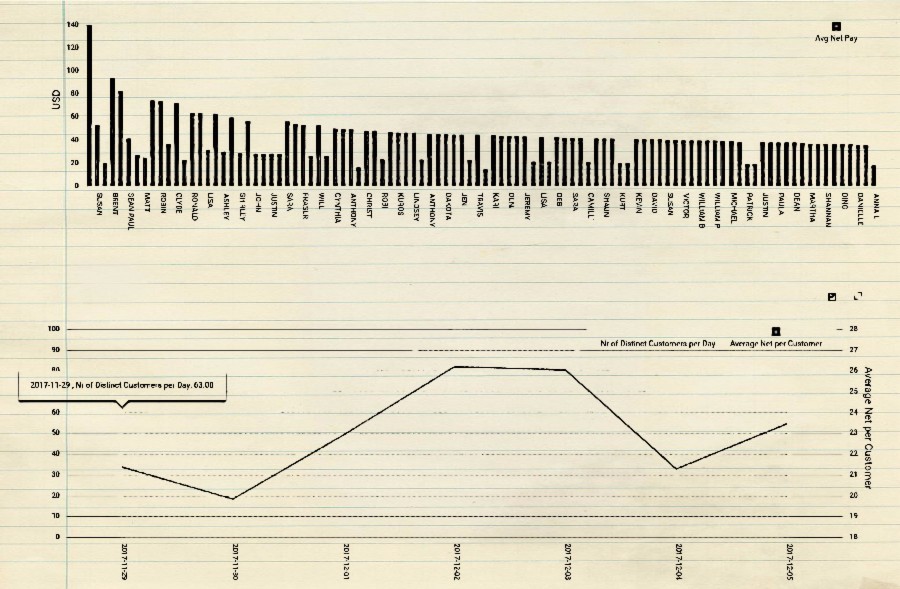
and even average Net amount per transaction for each customer :
And in the last chart, you can see a distinct number of customers and their average Net they have spent per day in the selected period of time.

At the bottom of the report, there is detailed table – you can search data and export in excel:
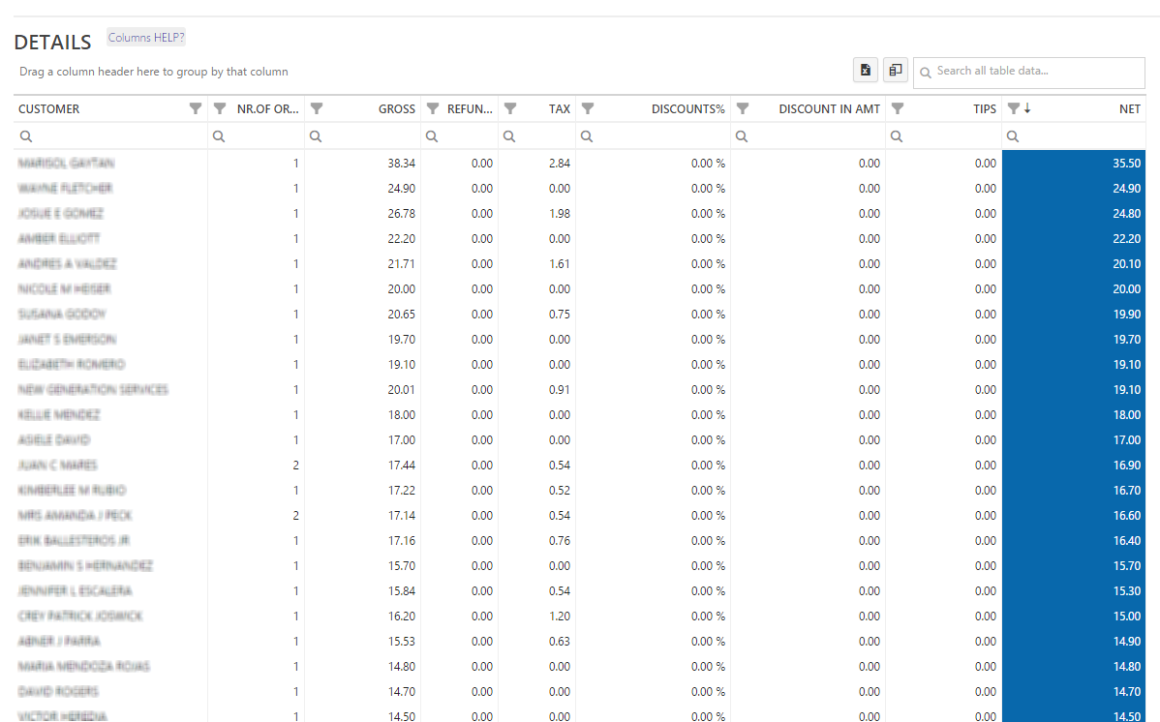
Data in a table can be easily arranged to suit your needs by simply drag and dropping columns where you want or even removing columns you do not need.
We hope that you will find this report useful and if you have any questions, please do not hesitate to ask
Happy Analyzing!
Your Analytics for Clover Team

