We are happy to inform you that we have published a new version of BusinessQ (v18.1). We are…
BusinessQ v18.3 news
We are happy to inform you that we have published a new version of BusinessQ (v18.3).
What is new in v18.3
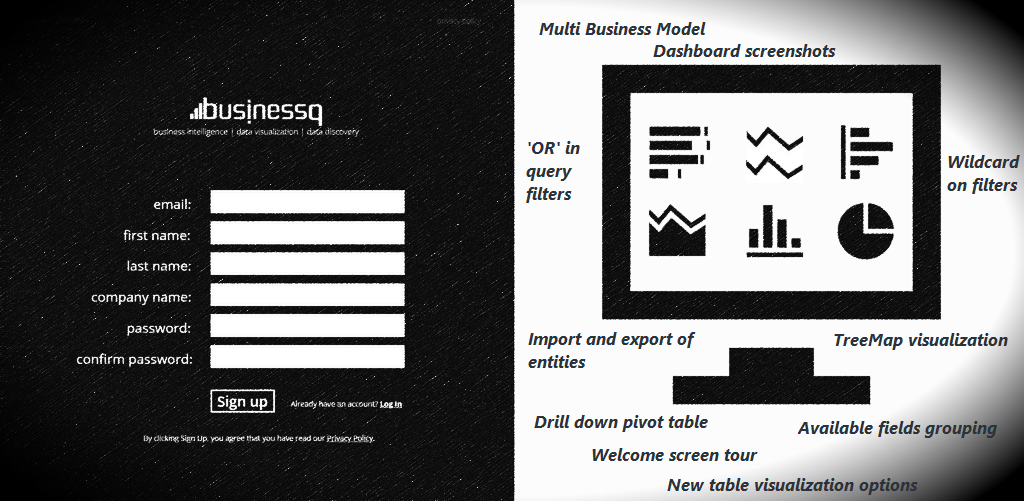
Multi Business Model
A new feature where you can create a new BM from other BMs.
Multi BM can only be created from regular non-multi BMs, in other words from BMs based on Data Source. You cannot create multi BM from other multi BMs.
This feature allows you to have data from different data sources in a single report.
There are two types of multi BMs that you can create and that are similar in concept to classic SQL constructs:
- JOIN – Join two or more Business Models just like they are tables in a relational database. Then create a new Business Model based on selected Business Models. For example, you can have your planning data from Excel together with actual sales data from the relational database in a single visualization.There are two subtypes of JOIN multi BM:
- Group/aggregate data BEFORE join.
- Group/aggregate data AFTER join.
- UNION – Combine data from two or more Business Models just like with UNION operator in SQL. Match columns from each Business Model with their equivalent. Finally, create a new Business Model based on matched columns. For example, you can combine data from different stores that have local databases as a single dataset.There are two subtypes of UNION multi BM:
- UNION – Removes duplicate data rows that come from different selected Business Models. Just like UNION operator in SQL.
- UNION ALL – Returns all data rows even if there are duplicates. Just like UNION ALL operator in SQL.
Creating reports based on multi BMs is identical to creating them from regular data source-based BMs. And they will follow rules defined on underlying BMs like BM filtering.
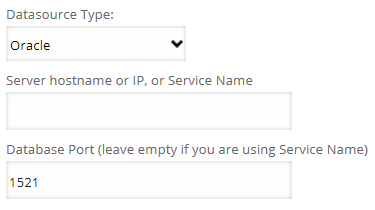
Connection to Oracle database if the instance uses ‘service name’
If the Oracle instance uses service name, it can be entered in the same field as server name/IP. But in this case, the port field must be empty – to distinguish between symbolic hostname and service name.
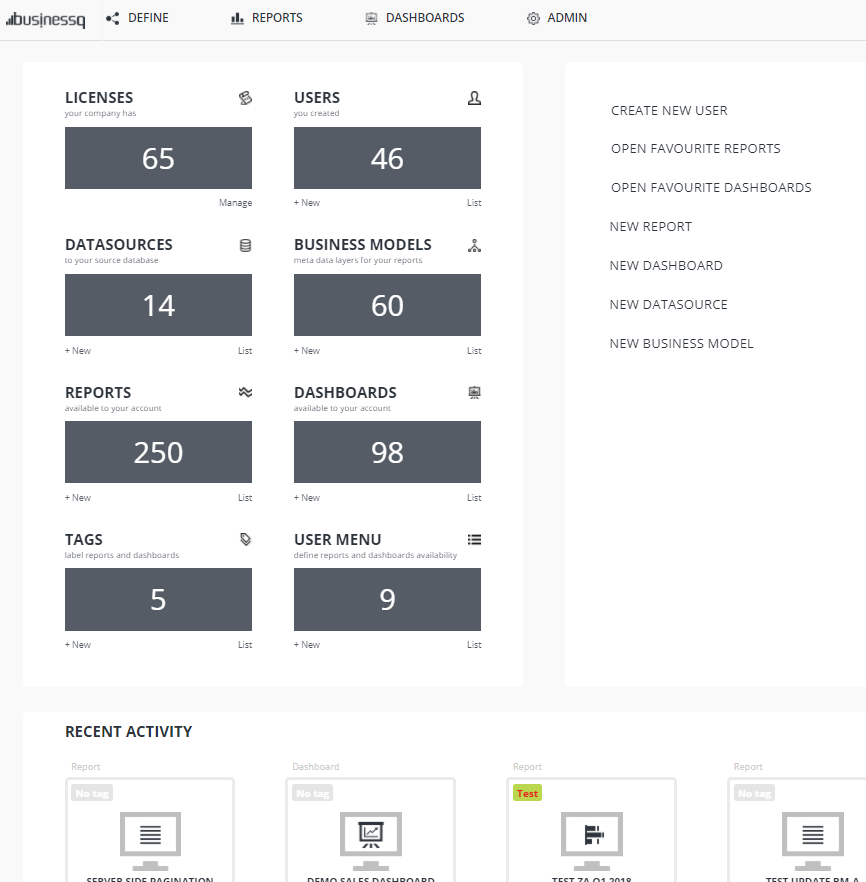
Dashboard screenshots
Users can now take screenshots of their dashboard and download them as .png files.
When a user clicks on the ‘IMG’ button on the dashboard:
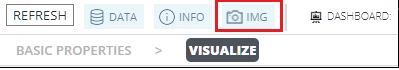
BusinessQ generates .png file of the dashboard that is currently open and the download will start.
All widget types will appear correctly on the screenshot except the ‘Web page’ widget, which will be displayed as a blank box for security reasons.
This feature is only available when a user is logged in to BusinessQ, which means that is also unavailable on public dashboards when a user is not logged in.
Import and export of entities
Now you can export and import different types of BQ entities.
Entities that you can migrate are dashboards, reports, business models, data sources and tags.
Once you select the type of entities that you want to export, a list will appear below and you can choose specific entities that you want to export.
You can export them with or without their dependencies.
- With dependencies – with other entities that selected exported entities are depended upon. For example, for migrating to a new installation.
- Without dependencies – export just selected entities, and then match depended entities with entities already present on imported installation. For example, for existing installations when you just want to migrate a few reports or dashboards.
Clicking on the EXPORT button will create a BQ export file that can be saved as the attachment with ‘.bq‘ extension.
For import, you can choose between pasting content of the exported file as text, or uploading an exported file.
If export included dependencies, clicking on the IMPORT button will import all entities.
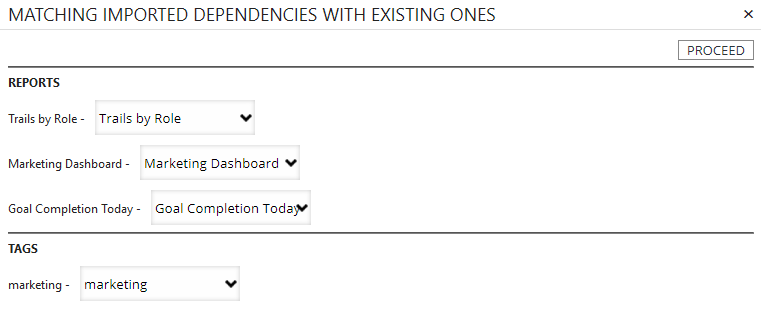
If export didn’t include dependencies, clicking on the IMPORT button will present a dialog where you can match exported entities’ dependencies with existing entities on imported/current instance. For example, if you export a few dashboards without dependencies, you will have to match the reports and tags those exported dashboards are dependent on with reports and tags on the current instance.
For export you cannot mix and match different entity types – in a single export, you can only export entities of a single type. If you just want to migrate a few reports and dashboards to another instance that already has required business models and data sources, you will first have to export new reports without dependencies, and match dependencies while importing on another instance. And then create another export with new dashboards without dependencies, and again match dependencies while importing on another instance.
TreeMap visualization
You can now add a new visualization type called the TreeMap.
The TreeMap is a visualization that displays hierarchical data by using nested rectangles whose sizes are proportional to their values.
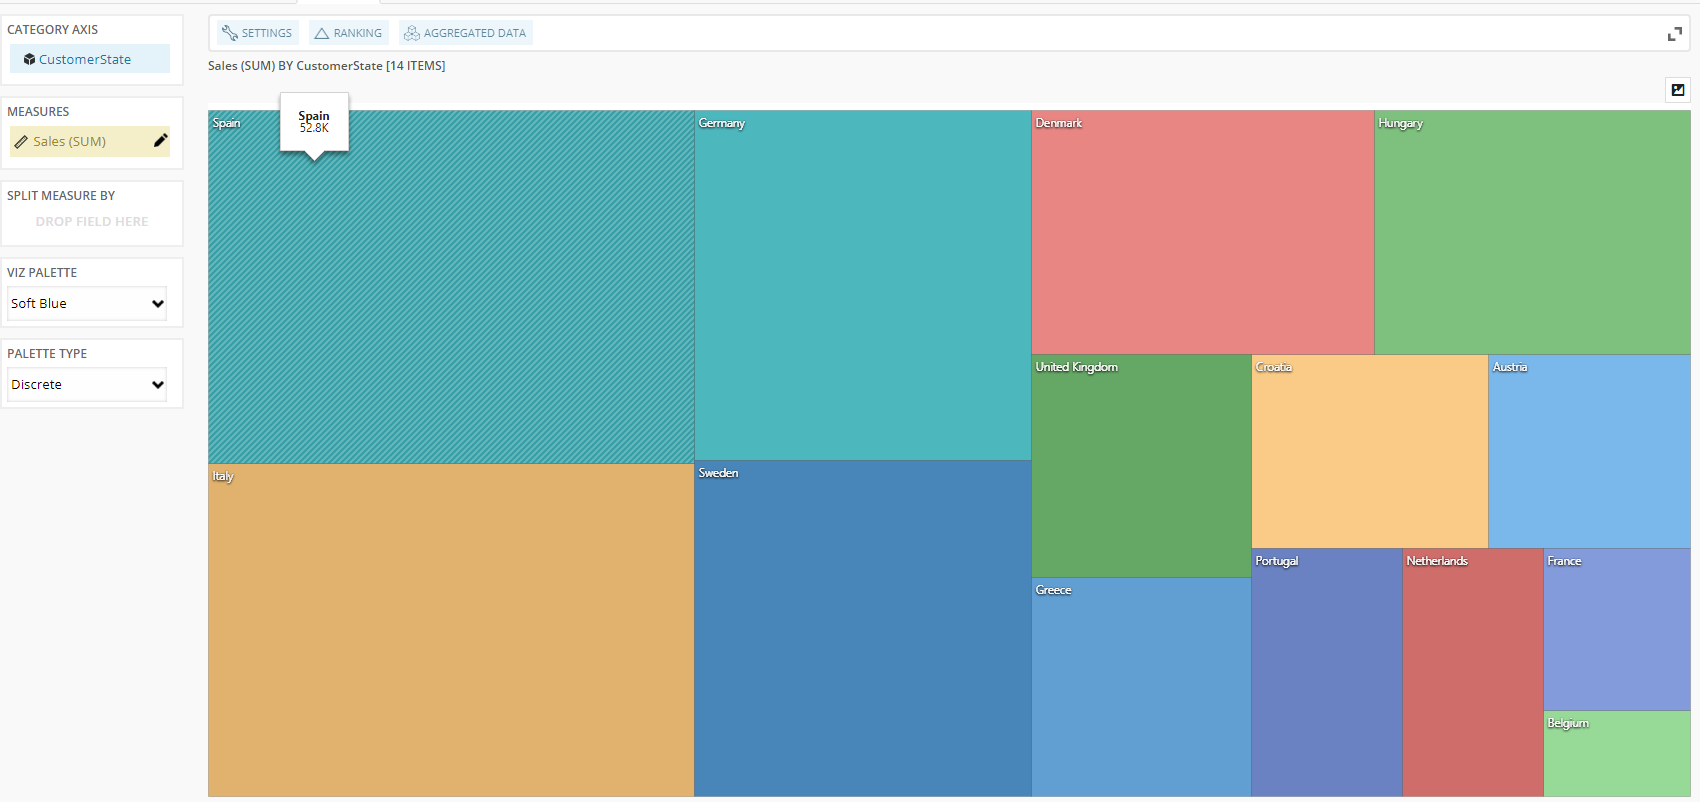
The visualization takes one measure and one dimension which can be split by another dimension. Many unique options were added to this visualization such as different palettes, options of displaying color in multiple ways and display direction of rectangles.
New pivot table option – drill down
The pivot table now has a new feature, the drill down. If you have multiple fields in a row you can double click on that row to get a pop up with a complete hierarchy of that cell
New query filter options – predefined dates
When determining our query filters, we have added a new option for our date type fields. You can now define predefined date ranges:
YTD – Year-To-Date
MTD – Month-To-Date
WTD– Week-To-Date
Last X days including/excluding today
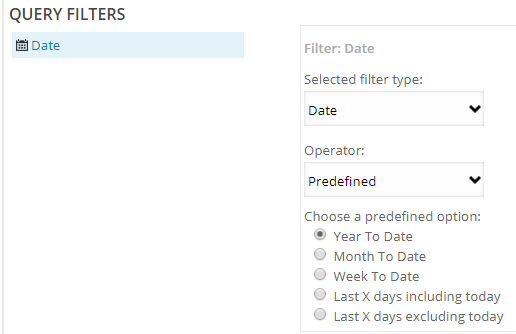
When you open your visualizations, you will get a predefined date range you can’t change. This option is meant for users who have fixed and specific date intervals they often use and that they rarely change.
New menu creation options
Now you have the option to select all or remove all existing reports or dashboards from the menu. There is also an additional refresh button added so you can always fetch the newest version of your report and dashboard list without refreshing the whole page.
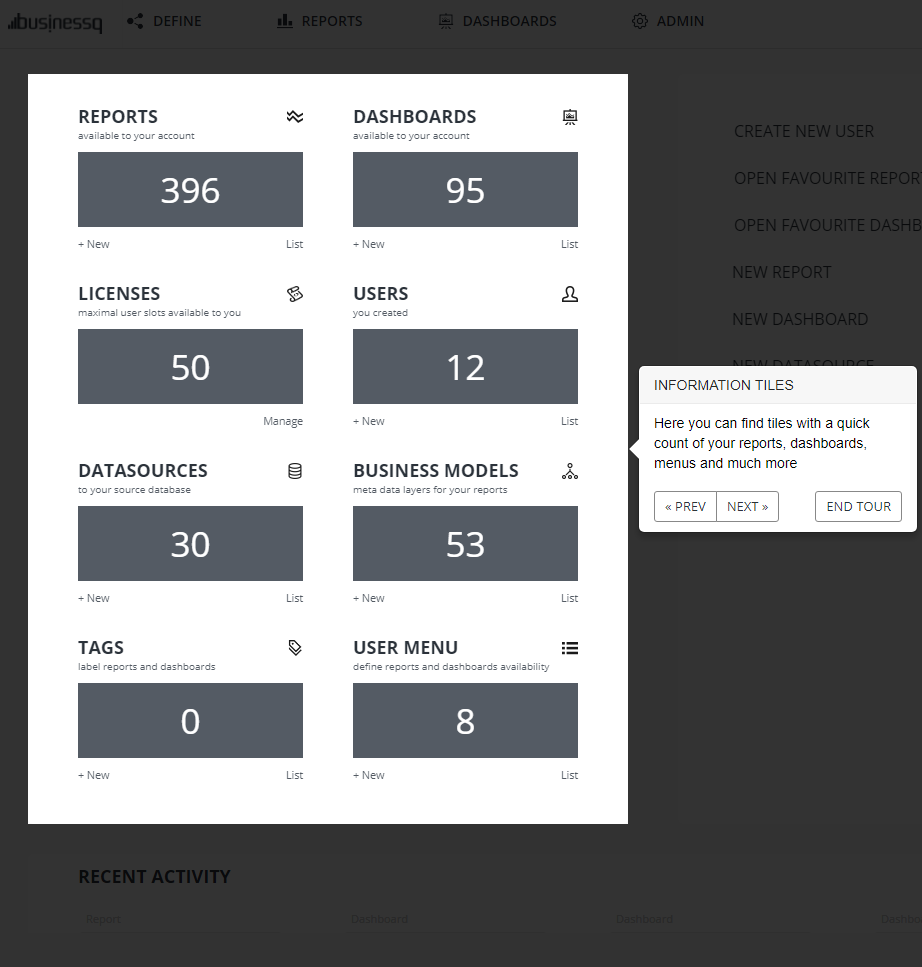
Welcome screen tour
We’ve introduced a new tour feature for our welcome screen. Any new user will automatically trigger the tour the first time they log in and any existing user can click on the most bottom link in the quick links section on the right side of the welcome screen. This will prompt the tour to begin.
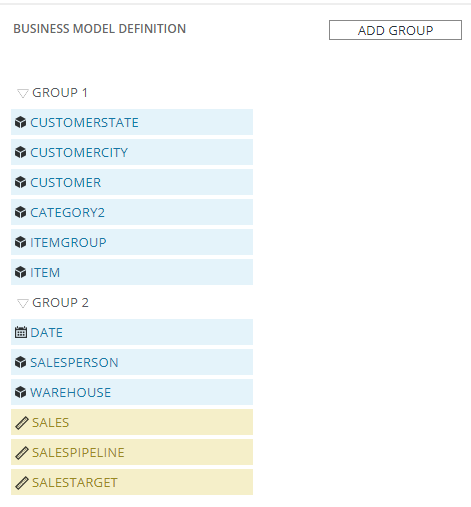
Available fields grouping
You can now group fields into sections within your model. When defining your model definitions for your business model groups can be added for better visual distinction. Clicking on the ADD GROUP button adds a new group field at the top of the list.
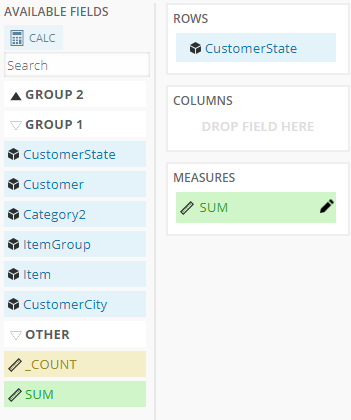
These groups are used within your visualizations for a better distinction and classification of your fields. You can hide and show certain groups so only fields you truly need are shown.
Business model definition: Available fields on report:
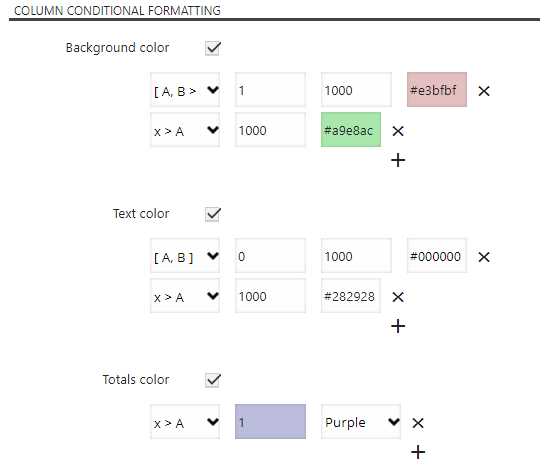
New table visualization options
In the general settings, you can now enable/disable row and column borders.
There are now new header options for both rows and measures including font, font size and color options to customize your headers.
Furthermore, there is conditional formatting for measures and lesser extent dimension. Depending on the values within cells the color and background color can change. This also applies to summary numbers. This feature was made to give our users better overall table visualizations with criteria they themselves set.
OR in query filters
We have added an input field within query filter selection section. This field can be filled with a custom handwritten SQL query.
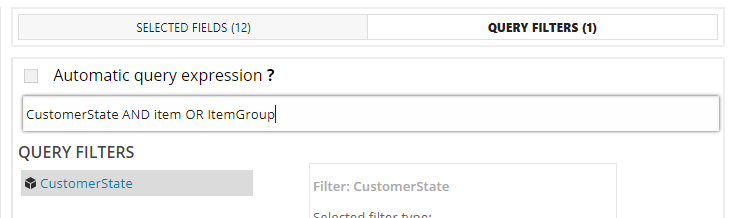
However, doing so disables the selection of fields and only pits the user to the manual expression he wrote. Disabling this feature returns the selection to the default mode and selection of fields become available again.
This feature is more catered towards our advanced users as it requires some understanding of SQL queries.
On the server side, a text is searched by filter names and replaces with real filter values. This currently means if there is a filter named AND or OR, this feature will not work properly!
Wildcard on filters
It is now possible to use wildcard for filtering value. Searching for “Co*on” will find: “Configuration“, “Colocation“, “Concatenation“,”Cooperation“, “Compilation“.
This feature is available in:
Local filters(report/dashboard)
Query filters(report)
Table visualisation
Filtering, in the query filter section, can also be combined with filter types: “Contains“, “Does not contain“, “Starts with“, “End with“, “Equals“, “Does not equal“.
We are developers of data visualization software BusinessQ. Try it for free and make reports and dashboards that make sense, without chart junk.
Related posts