We are happy to inform you that we have published a new version of BusinessQ (v18.3). What is…
BusinessQ v17.3
We are happy to inform you that we have published new version of BusinessQ (v17.3).
There is a lot of new features so we will describe some of the most important.
Major features of BusinessQ 17.3
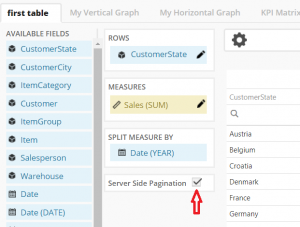
Server-side pagination – if you have millions of data in your report and you wish to see all of them in a table this is the perfect feature for you. If you choose server-side pagination that means that BusinessQ will be getting them part by part (when you are scrolling or switching pages in a table) so getting data will be much faster. This feature doesn’t allow you grouping of your data but only their overview. To enable this feature simply mark checkbox for server-side pagination in table visualization on your report.
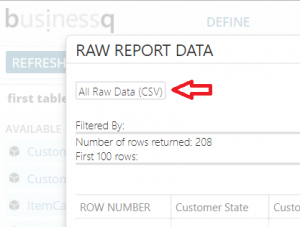
Export all raw data – as you probably know, you can export your raw data from report. Until now you were able to export first 100 rows of your raw data. We have now enabled you to export all raw data that is used in some report. To do that all you have to do is click on “Raw data” icon ( ![]() ) to see your raw data and then click “All raw data (CSV)” button.
) to see your raw data and then click “All raw data (CSV)” button.
Localization – we have localized all BusinessQ labels which means that now it can be translated in every language. That will allow our partners from different countries to adapt it for users in their country.
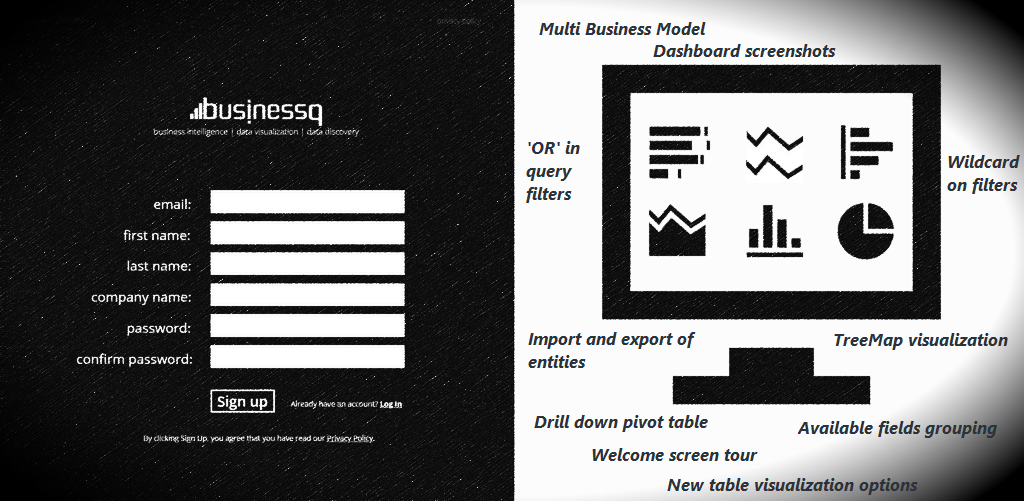
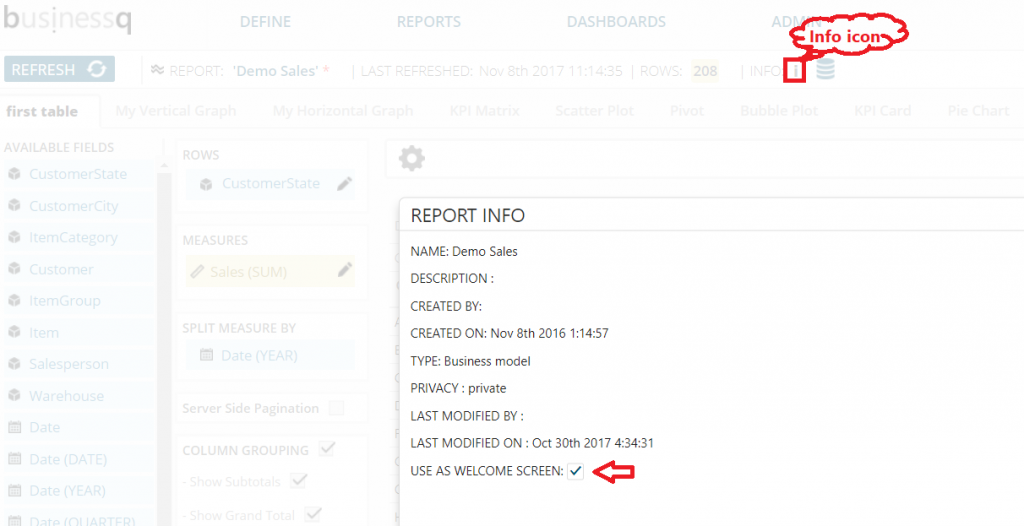
Report or Dashboard instead of a Welcome screen – if you have a report or dashboard which you are looking at every day you can simply select to open it by default when you log into BusinessQ. Of course, that can be only one report or dashboard so when you select another one, we will automatically unselect first one. To select which report or dashboard you wish to use as welcome screen click on info icon on report or dashboard and mark checkbox “Use as welcome screen”.
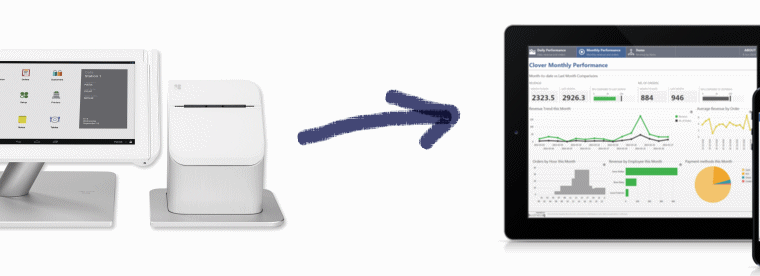
Custom link as Report – you can now use a custom link as report. That means that you can do “soft” integration of your web page (e.g. some input form) with BusinessQ. Instead of opening that page outside of BusinessQ you can integrate it in BusinessQ environment (e.g. for some larger business intelligence project you doing).
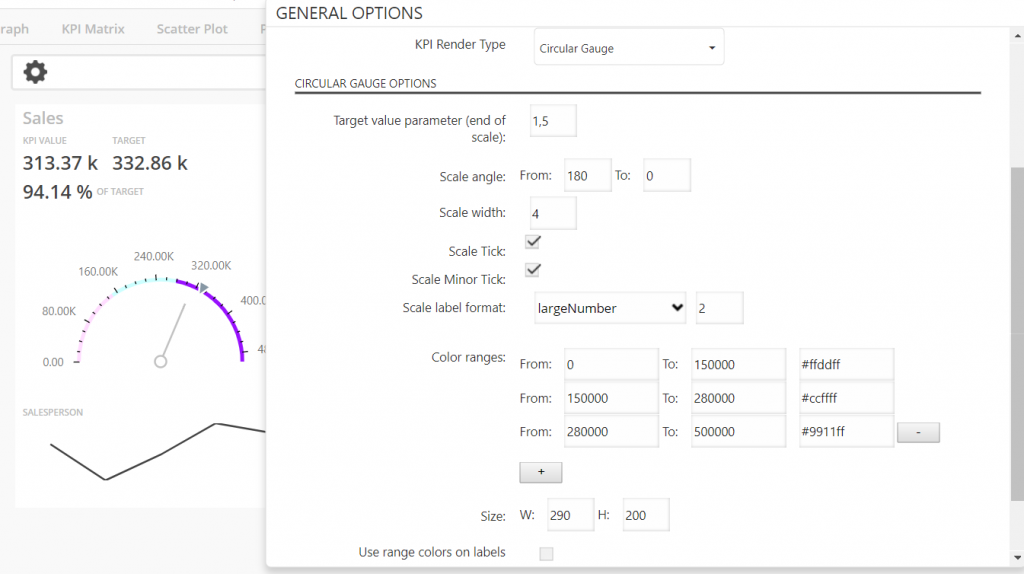
Circular gauge in KPI Card – we have added circular gauge component on KPI Card. It is helpful when you check your reports often and you wish to see every small change. It is easier to see small changes on circular gauge than on linear gauge. To change gauge you need to click on Settings icon and set “KPI Render Type”. When you select Circular gauge you will see fields with options for that type.
We hope that you enjoy our application and we are trying to make it better every day. For any questions and suggestions contact us on info@qualia.hr .
We are developers of data visualization software BusinessQ. Try it for free and make reports and dashboards that makes sense, without chart junk.
Related posts