Whether the type of business you are in, customers are your backbone. Without customers, no…
Item / Order Averages
Hello everyone,
What insights can you get from this report?
For example, you are making cupcakes, and often you have cupcakes that are leftover because you made too many of them (or you make a fewer amount of cupcakes than average demand is). It’s a shame to throw food away as well as your time and resources spent while making them. This report will tell you average sales of this specific Cupcake item either per day or per specific hour of a day.
Let’s say today is a Monday. You came to work and you start preparing your business for the start of the day. And you wonder, how many cupcakes/chickens/Beers..etc. was sold on average each Monday?
You simply open our report and select Last 31 or 62 days and we calculate and show you your item average sales on the table.
You can easily find an average of particular items sale for the whole day, but more interesting is that you can see averages per hour. Just by ‘expanding’ hour you are interested in from the table.
As simple and easy as that. Further explanation with pictures will follow:
As simple and easy as that. Further explanation with pictures will follow:
Item / Order Averages
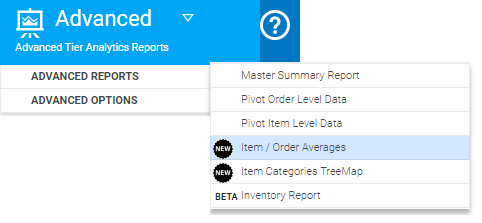
This new report is available to our Advanced Analytics users and it can be found on the menu like shown in the picture below:
Once you open the report and select for example last 62 days you will see following:
A chart with an average number of Items sold per day and another chart showing you an average number of Orders made per day.
After these charts, you will see how many specific days were in this period of time you are analyzing.
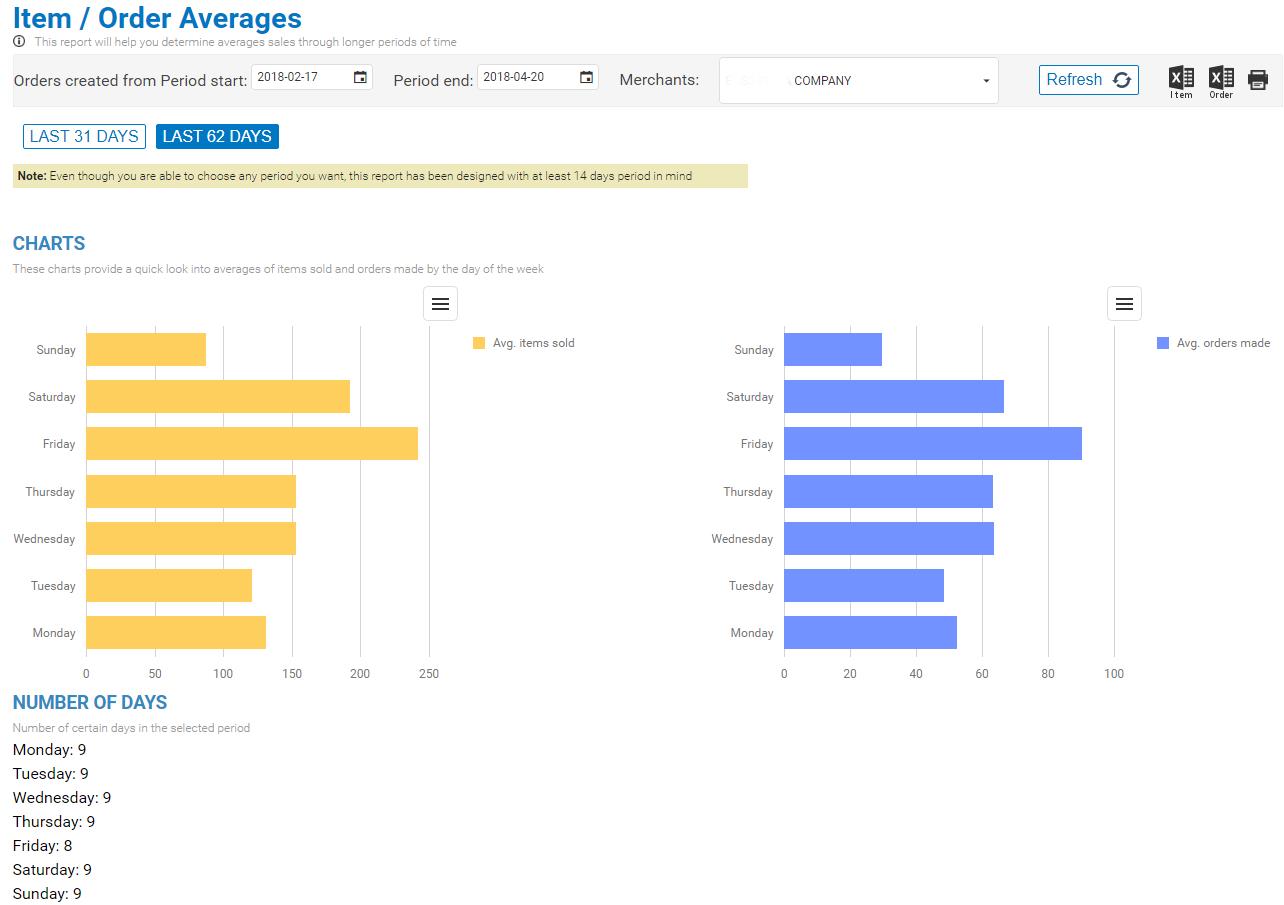
As you can see above, in this selected period there were 9 Mondays.
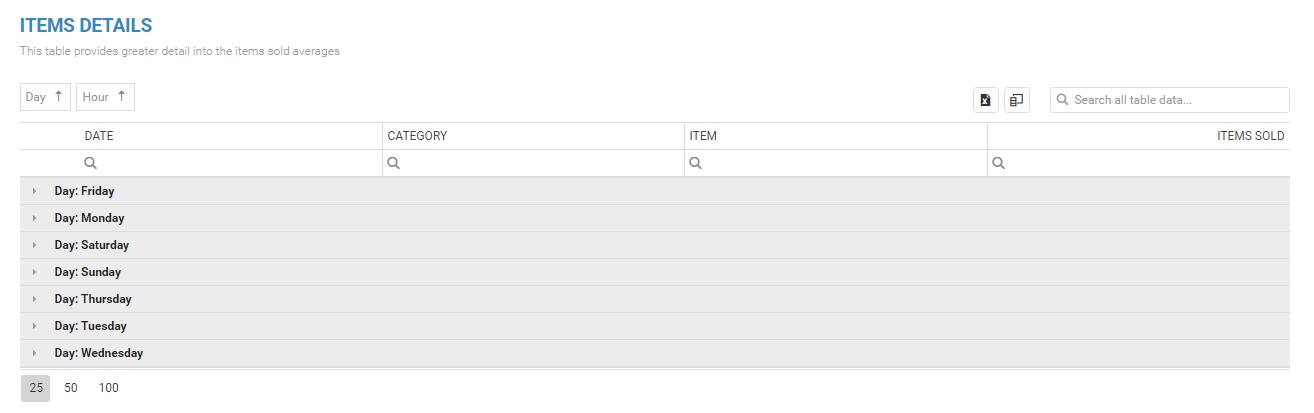
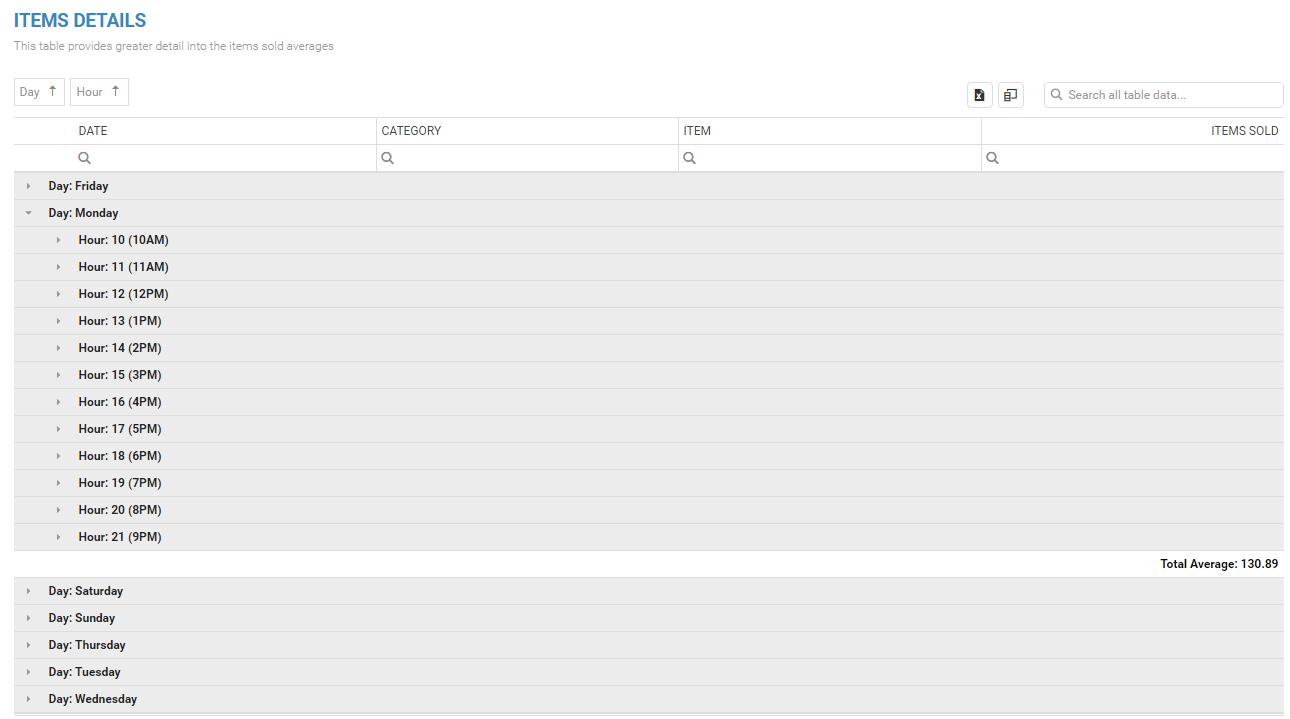
You will see a table with Item Averages:
If you just ‘expand’ Monday you will see in this example that average item sale(of all items) for Monday is 130.89.
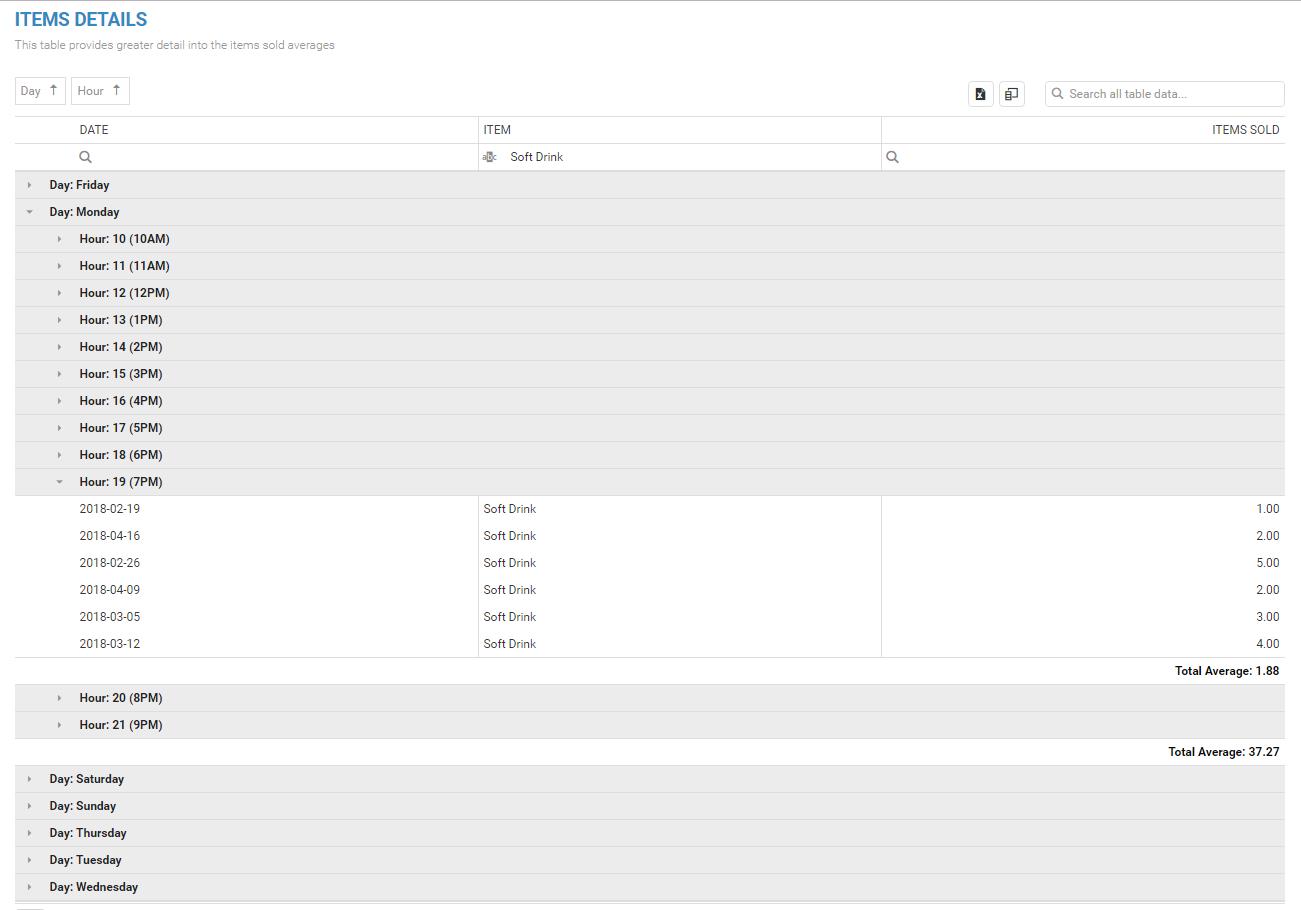
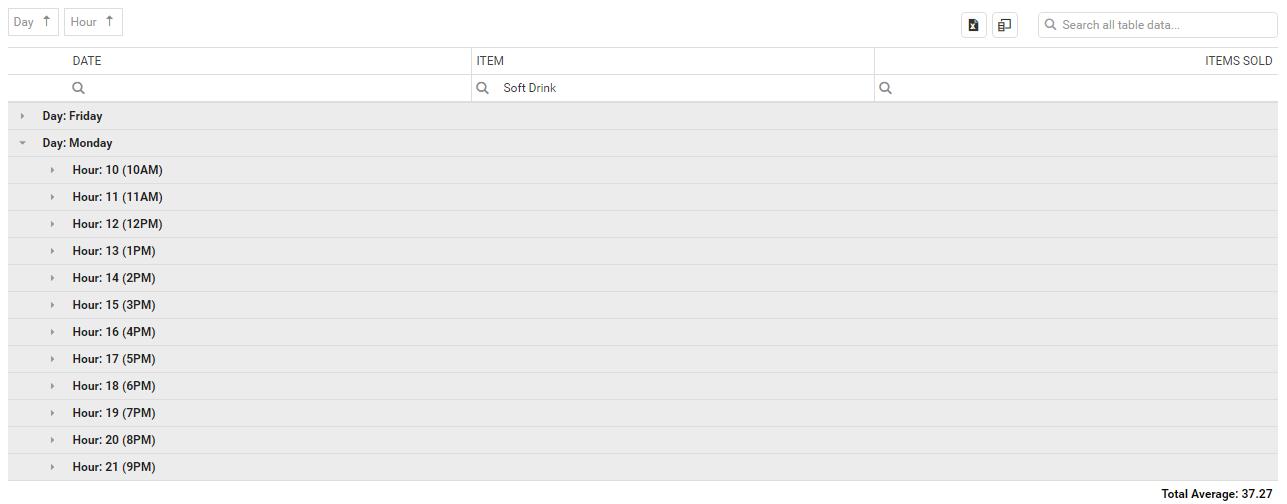
You can go further and find out about Item called Soft Drink and its total Monday Average sale. From the picture below merchant can expect to sell approximately 38 soft drinks.(note that this is just one way of filtering specific item, later we will show you how to group table by items or categories)
You can go further and expand specific hour to see the average hourly sale for this specific day/hour/item:
In the picture above you can see an average sale of this item “Soft Drink” in this selected period of time for this specific hour we wanted to see the average (7 pm).
In the period we were analyzing were 9 Mondays. You can see that sales occurred only at 6 Mondays at this specific hour.
Thus Total Average for 7pm for this item is (1+2+5+2+3+4) / 9 = 1.88
In just a few clicks you can find out useful information.
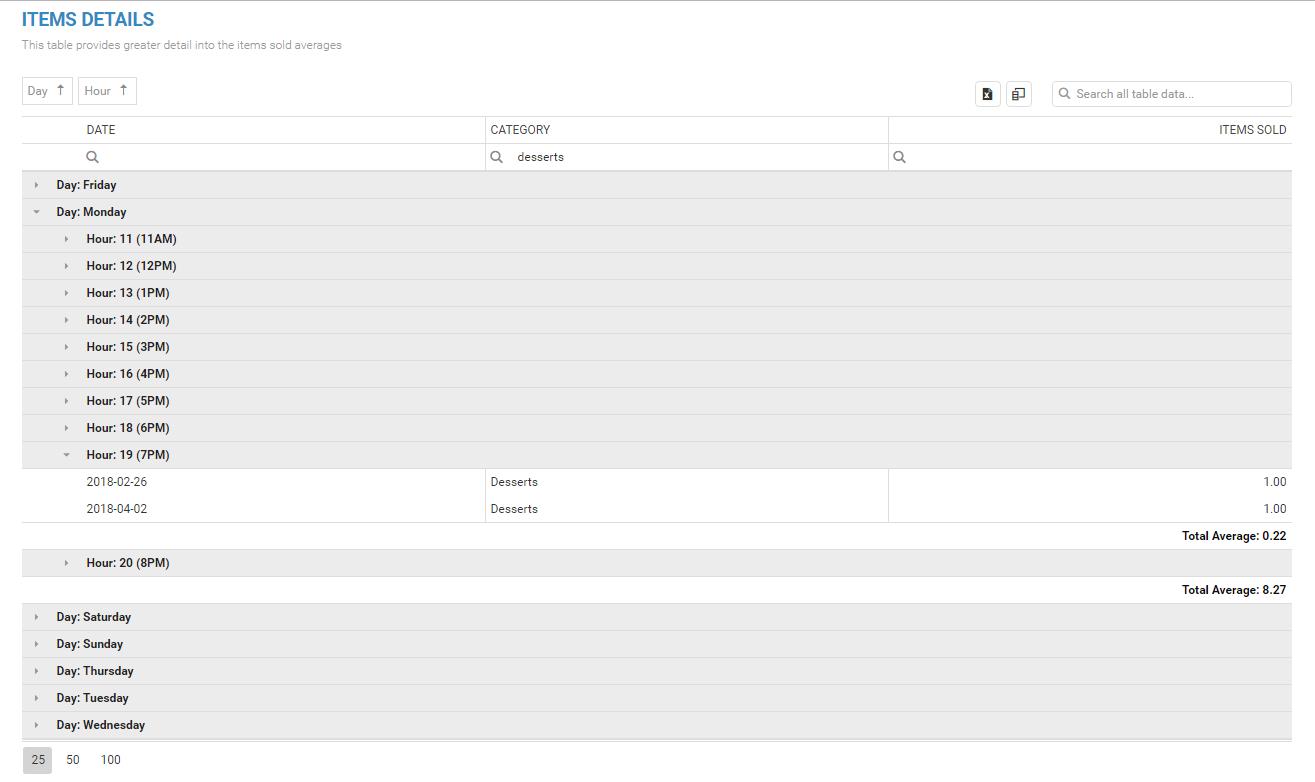
You can also find out particular Categories item average sales by typing category name, in this example, the category name is ‘desserts’:
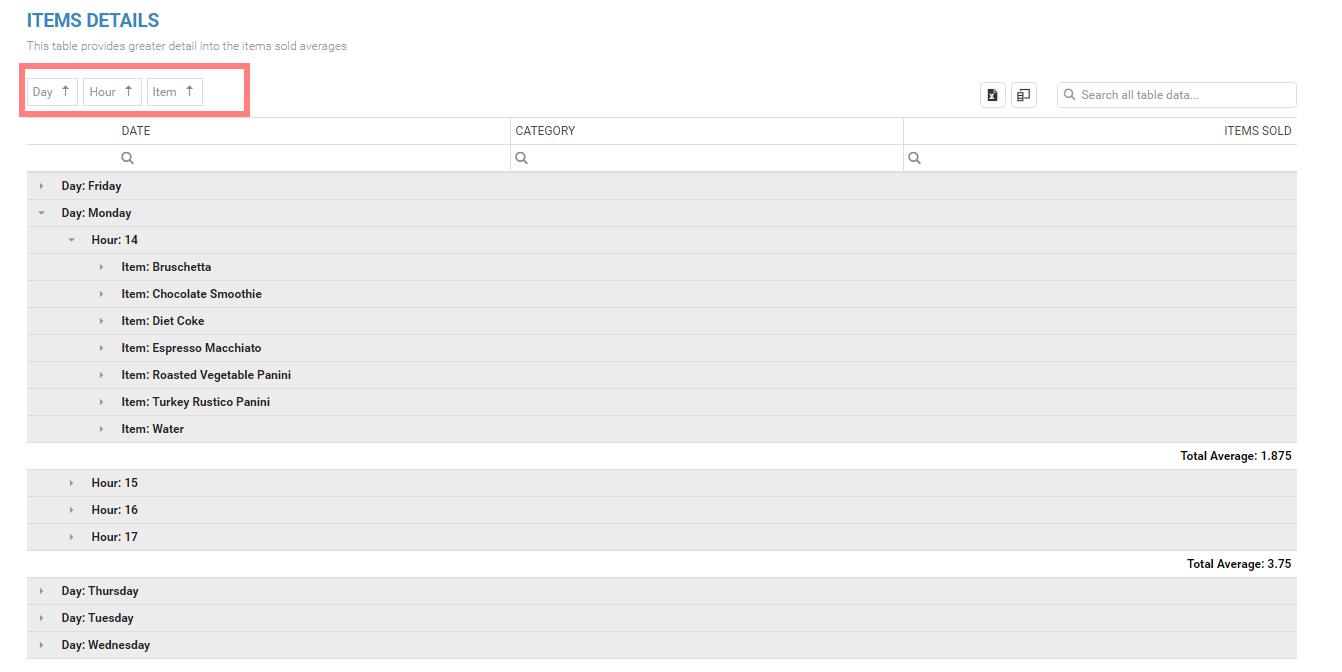
You can group table the way you want. In the following picture, we grouped it by Day-Hour-Item columns
This way you do not need to type items name, you can expand hours column and then just expand the item to see its average values.
Same can be achieved with category column.
Each table can be exported with one click export to Excel. Same goes for charts as well, one-click export to picture type you chose.
Hopefully, this new report will help you in preparing your business for everyday sales or even help you to find out how many items you need to order for following days of the week.
We hope that you will find this report useful and if you have any questions, please do not hesitate to ask
Happy Analyzing!
Your Analytics for Clover Team
Related posts


