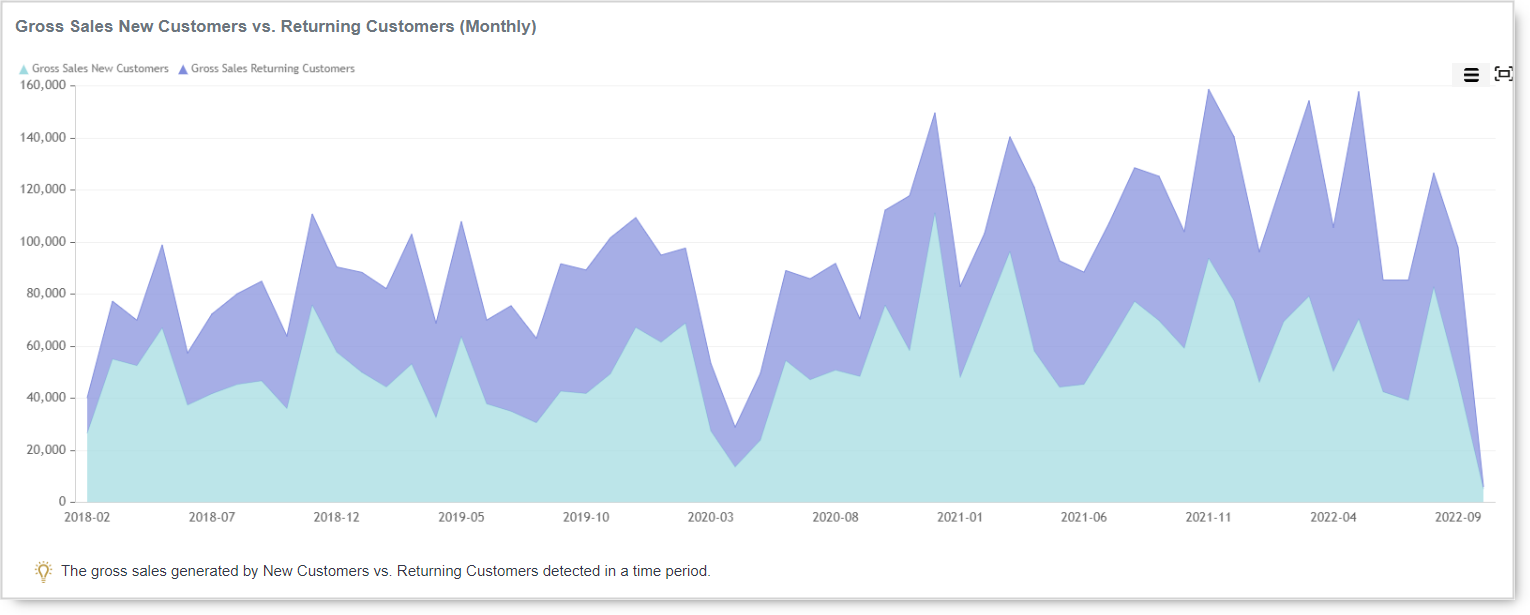
Whether the type of business you are in, customers are your backbone. Without customers, no…
Analytics App – Master Summary Report
We developed our new report – ‘Master Summary Report’ – in Analytics app for Clover.
This report is one of the many new advanced features that will become available to our Advanced Tier Analytics users once we publish it in the Clover App Market.
MASTER SUMMARY REPORT
Master Summary report summarizes all the important aspects of your business in one place. Since each business has different aspects that are crucial for decision making, we are giving you the ability to chose which aspects you wish to monitor in this report. Just select what you need from our predefined tables and your master report is ready!
All relevant informations are in one place, so you also have the ability to print this report on paper, or save the whole report in PDF form. All of this is now available with just a few clicks.
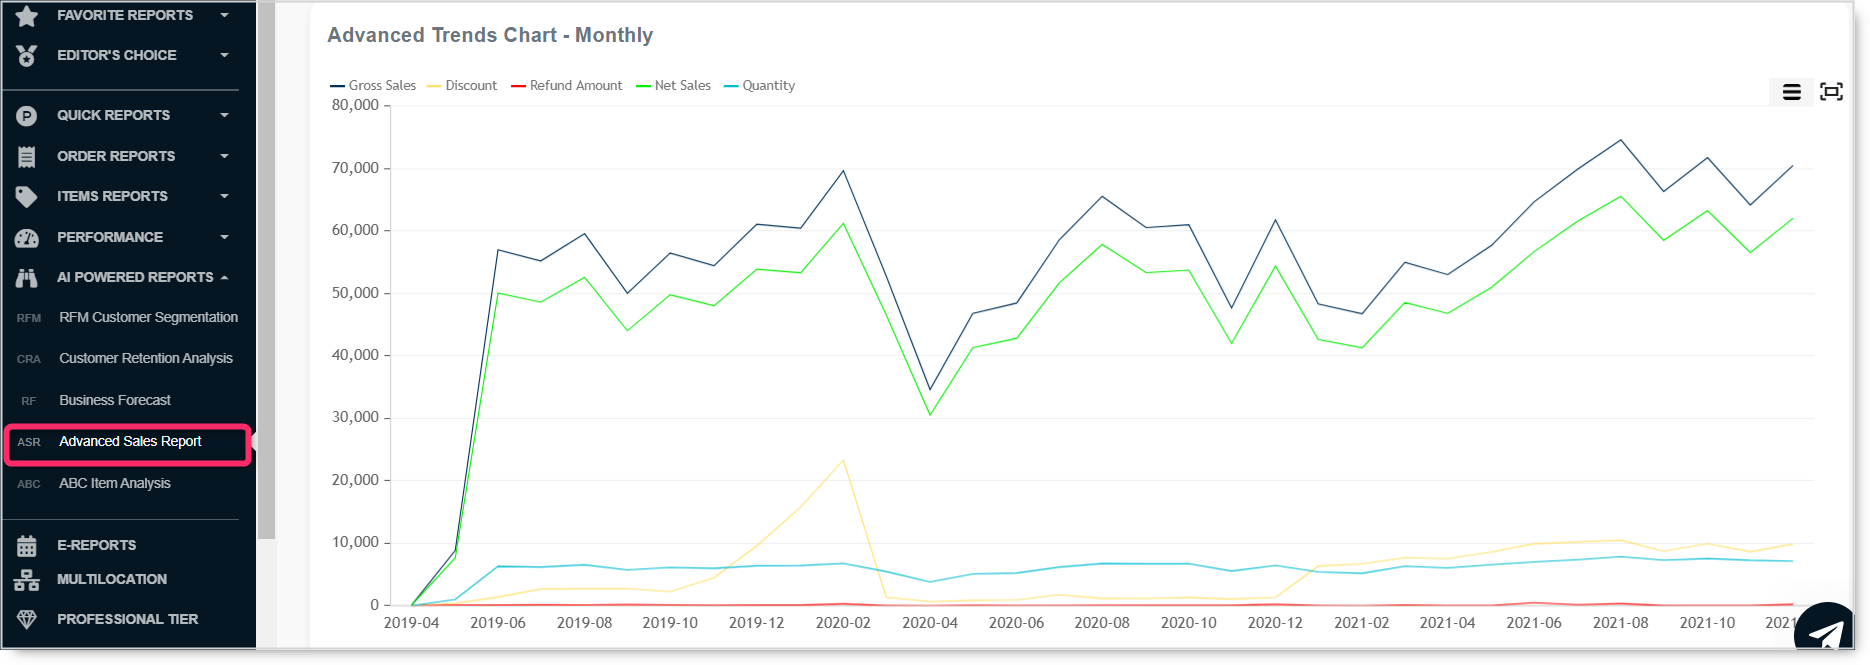
You can find Master Summary report in new, Advanced section of the Analytics App:
When you first open Master Summary report, it will show you following tables:
- Summary,
- Employees,
- Tenders,
- Hours,
- Day Parts
- and Multi Location.
There are many more tables that can be found in Master Summary report, but are not visible the first time you open this report, including:
- Devices,
- Order Types,
- Day in a Week,
- Credit Cards,
- Categories and Labels.
SELECTION OF TABLES FOR MASTER SUMMARY REPORT
To see the full list of summary tables and to select/deselect them, press on the ‘Arrange tables in Master Summary Report’ button:
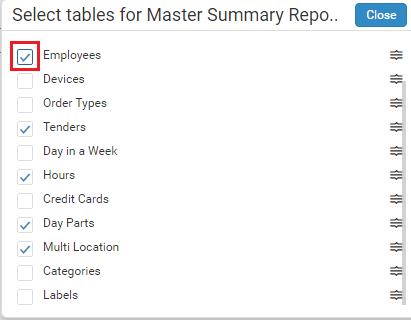
To select which tables you wish to see in the Master Summary Report, simply click on the checkbox next to the desired table or click on the table’s name:
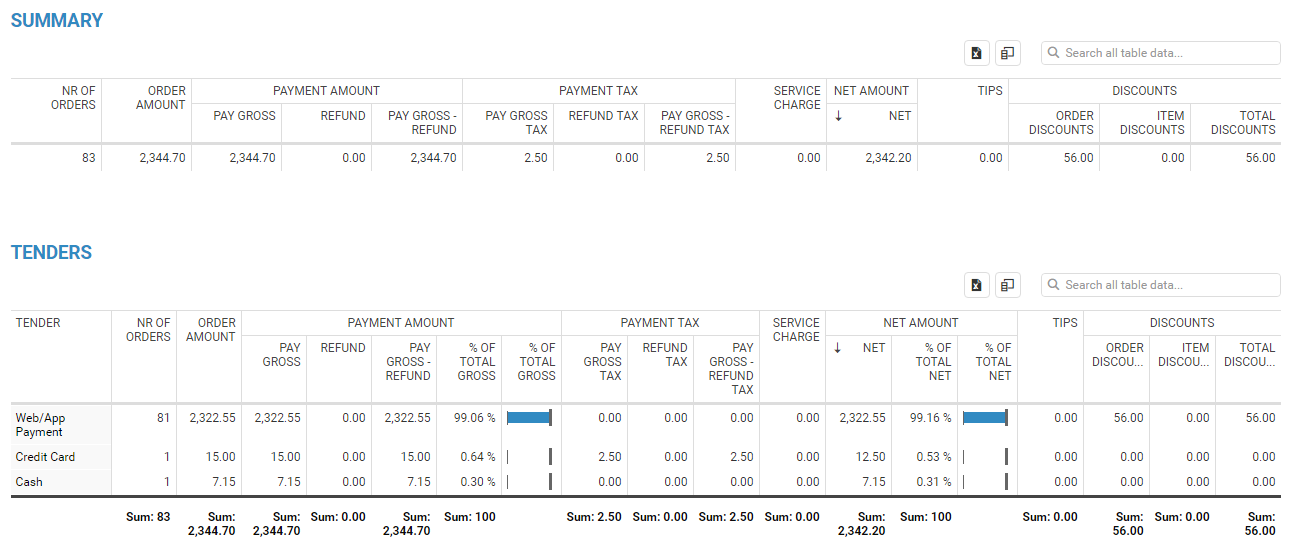
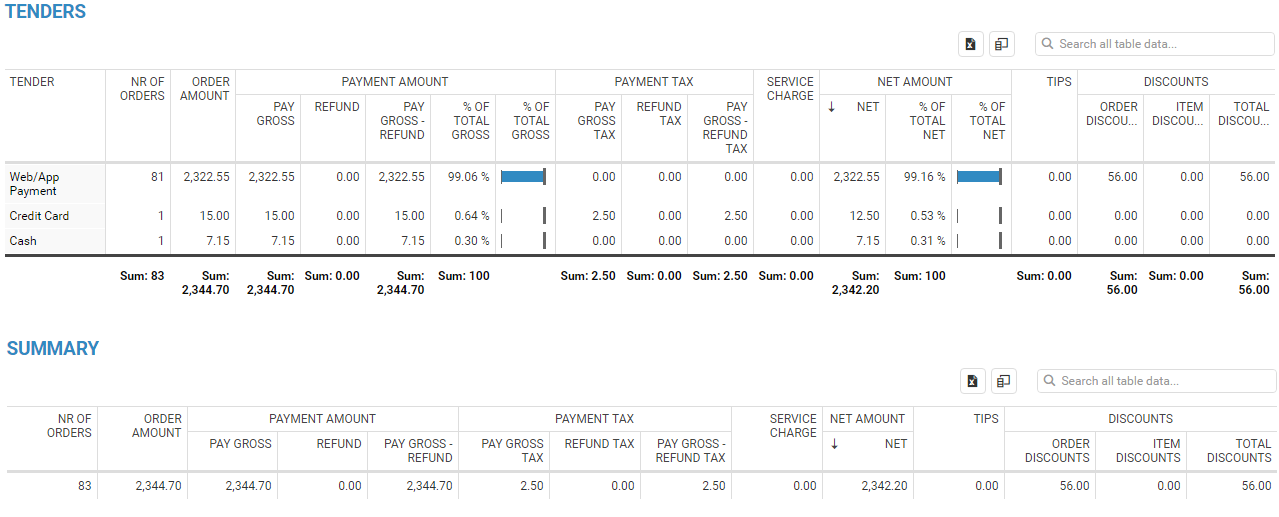
In my example, I will choose only Summary and Tenders tables. This is how my Master Summary report looks like after selecting this tables:
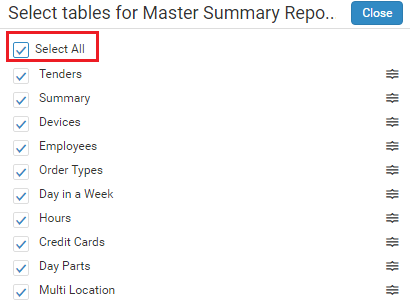
If you wish to select all tables (or deselect) you can press on the ‘Select All’ button ( presss again to deselect all) :
REARRANGING ORDER OF TABLES
Except for the option to choose desired tables, you also have the ability to select the order of tables that will appear on the Master Summary report. This option is available once you press the ‘Arrange tables in Master Summary Report’. To rearrange the order of tables, click and drag on the icon on the right of the table name:
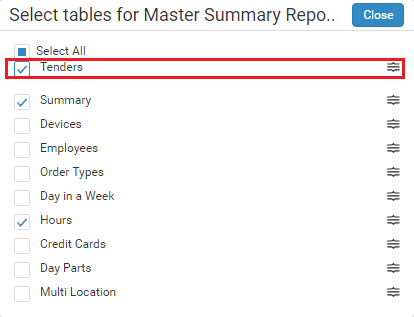
Once you click on the rearrange icon of the selected table, simply drag&drop this table anywhere in the list. In my example, I will drag Tenders to the first place in the list:
Immediately, I will see that the Tenders table got to the top of my Master Summary report:
SOME OTHER OPTIONS
- Each table can be exported in Excel by pressing on the ‘Export all data’ icon:

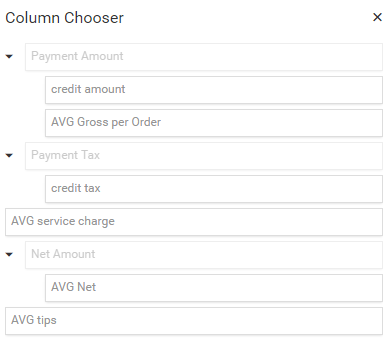
- Except for the columns that you currently see in tables, you can also choose other columns by pressing on the Column Chooser icon:
To see all the options that tables in Analytics offer, check out our Tips&Tricks section for tables.
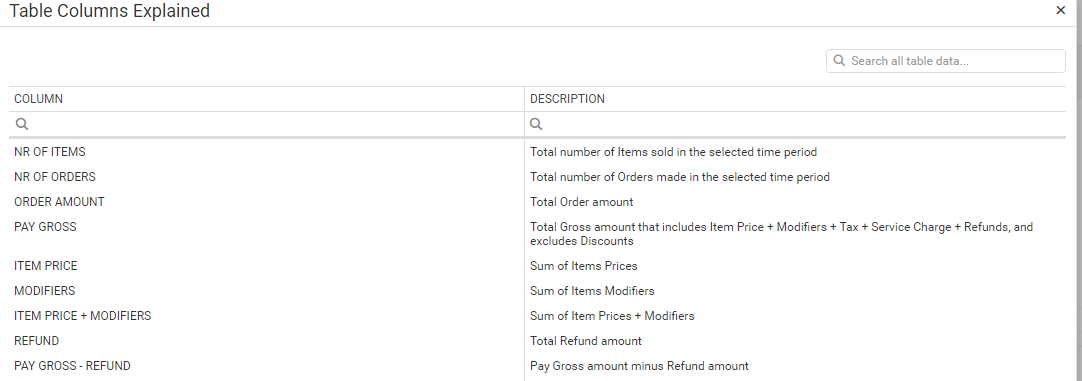
3. If you have troubles understanding what each column in tables mean, you can click on the Column Help button. By pressing on that button, you will get the list of all columns in tables with descriptions.
PRINTING MASTER SUMMARY REPORT
At the top right corner of the Master Summary report, you will find Print page icon:
From there you can either print this report on the paper or you can save this report in the PDF form.
We hope you will find this new report useful.
You can contact us anytime for any questions or comments, at clover@qualia.hr.
Happy Analyzing!
Your Analytics for Clover Team
