Whether the type of business you are in, customers are your backbone. Without customers, no…
Analytics: Stock Value Dashboard
Have you ever wondered how much all your stock inventory is worth? Or how much different categories on stock are worth? Or how much your stock is worth after you deduct your items costs value? In our simple, yet powerful dashboard, we present you all that. With our quick summary, two charts and detailed table, you will have complete reporting control over your inventory for all your locations (Merchants).
Our new Stock Value Dashboard can be found in Analytics app, under Dashboards -> Stock Value as shown on picture below.

CHART – Top 20 items by stock quantity in all categories
This chart shows which items you have in the largest amounts, no matter the category they are in.

CHART – Top 20 items by price value in all categories
In this chart, we present items that hold the biggest value among your inventory.

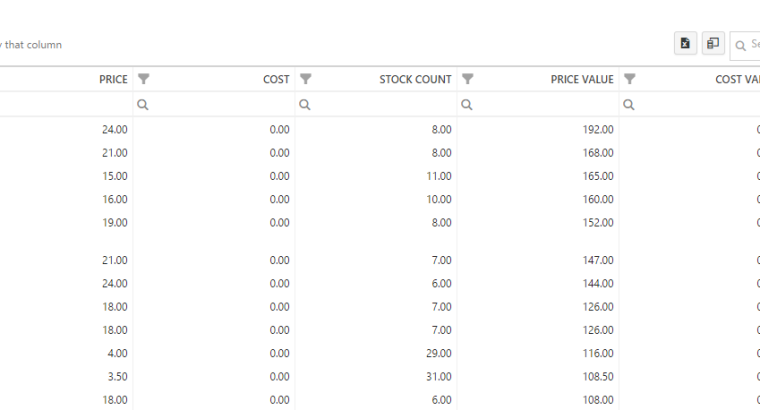
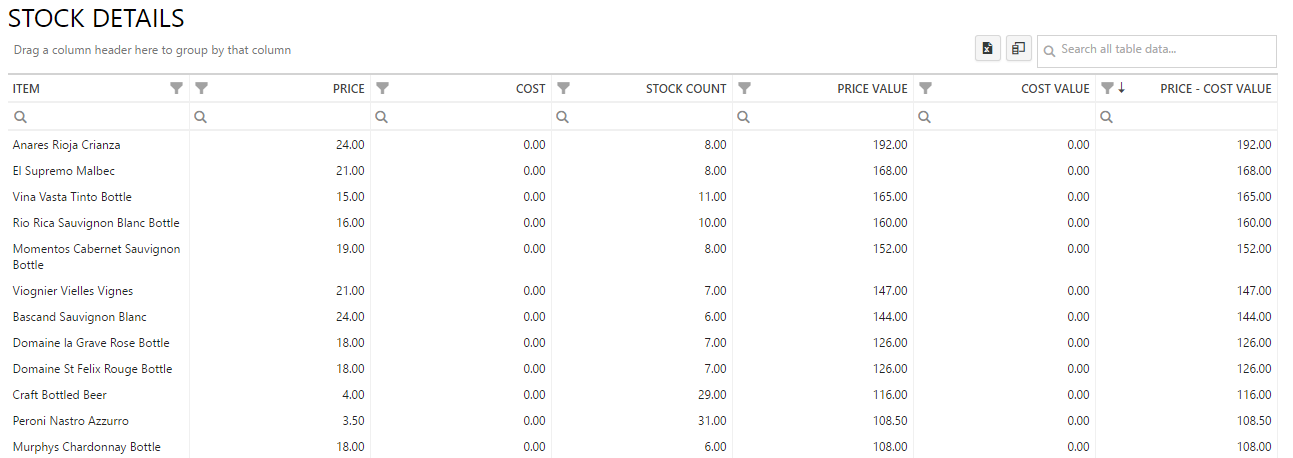
Main table shows all your inventory, their price, cost, stock count, price and cost value, and your gain after deducting cost from price. Inventory can be grouped by merchant, category, stock count and any other column of your choosing. This way, it is easy to see, for example, which item category will bring you the most profit, or which merchant has the lowest amounts of certain items on stock.
We hope you will find this new features useful.
Happy Analyzing!
Your Analytics for Clover Team
Related posts


