Whether the type of business you are in, customers are your backbone. Without customers, no…
Analytics New Features Feb 2015
We are happy to announce that we did a number of new improvements in the last weeks on our Analytics for Clover App.
The most important changes include:
1) Revenue Trends – beginning of the week mark
On Revenue Trends Report now you can see beginning of the week (Sunday) as black dot. That will help you to fast track week-to-week dynamics of your sales data:

Also, on graph, as well as on Details table we put day in the week name, for your better orientation:

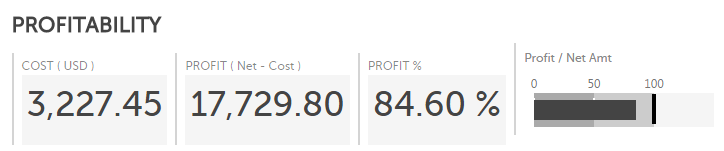
2) PROFITABILITY for Category, Item, Tag, SKU and Employee added!
In those reports, now you can find Profitability summary; if you enter Item Costs in Clover system, Analytics will deduct that amount from Net, showing you generated Profit in percent and appropriate bullet graph:

In addition, GUI tables will show Profit details, in absolute values, percentages and bullet graphs:

Table Columns Explained
- Times Sold : Number of times that Items was sold
- Price : SUM of Prices of Items defined in Clover
- Cost : SUM of Costs of Items defined in Clover
- Modifiers : SUM of Modifiers applied
- Discounts : SUM of Discounts given; Analytics will calculate Order level Discounts given in percent, Item level discount given in percent and Item level discount given in absolute amount. Analytics will NOT calculate Order level discount given in absolute amount.
- Tax : SUM of Tax Amount
- Tips : SUM of Tip Amount
- Gross : SUM of Gross Amount
- Net : SUM of Net Amount ( Gross – Tax ) | note: Analytics will not calculate Order level discount given in absolute amount and will not allocate it on Items on Orders. In those cases SUM of all Net Amounts from this column will not be equal to Total Net Amount – that was actually payed – from SUMMARY in the upper part of the screen.
- Profit : SUM of Profit Amount ( Net – Cost )
- Profit/Net : Percentage of Profit ( 100 * Profit/Net )
3) New Report – Revenue per SKU
If you’ve defined SKU codes on your Clover Items, you will love this new report. Check business performance, including Profitability per SKU!

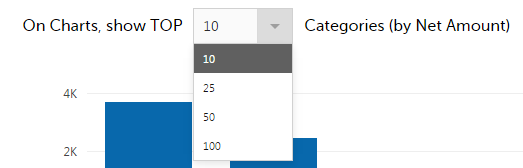
4) TOP X selections on Reports:
In order to ensure better visual presentation, on Reports you can now select to show only TOP 10, 25,50 or 100 Items / Tags / Categories / Employees / SKUs :
If you are looking for place to get started, check out our Analytics webpages.
If you have any questions about how to use Analytics, just contact us .
We are dedicated to offering you amazing support and we’re happy to help you get started.
Thanks,
Your Analytics for Clover Team
Related posts


