

OVERVIEW
WHAT is BusinessQ
BusinessQ is business intelligence, data visualization and data discovery software. Create clean, readable graphs and comprehensive dashboards from your data or spreadsheets.
BusinessQ provides the insights you need to make better business decisions.

Let BusinessQ tell you the story of your business data in precise, effective and unambiguous way – from monitoring your Sales, overseeing your Inventory, measuring business success, or tracking Key Performance Indicators (KPIs). It helps companies to see otherwise hidden patterns, to spot business problems on time as well as to identify useful opportunities in their raw data.
Small and medium businesses don’t want to and can’t invest 100s of thousands EUR or more on long-lasting BI implementations and can’t hire new employees to support and work on these systems. BusinessQ is made with small and midsize businesses at mind; our focus is on user-friendliness, interactivity, fast results and implementation, low-cost and best practices data visualization.
WHY
Every company, no matter how big or small, needs Reports.
Daily, Monthy, Yearly Reports, Performance reports, Controlling, Reports for administration, Reports for Management…
Use BusinessQ to get new reporting ideas, to create Reports and share them. Create appropriate Dashboards and take action on what is really important; stay up-to-date with what’s going in your business.
BusinessQ is all about making that easy and fun while maintaining data visualization integrity.
Spend time reading and understanding your Reports, not making them!
- If Data is poorly represented, the BI project will fail
- Without proper data visualization your are stuck with mere numbers and you’ll spend hours trying to understand them
- Raw data can only be valuable when it is understood, and not just when it is available
- Our brain is pattern-detecting software; BusinessQ is leveraging that fact
- BusinessQ has built-in best practice data visualization
- Business Dashboards are not here to entertain managers, but to inform them
BusinessQ Live Dashboard Samples
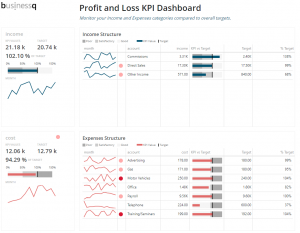
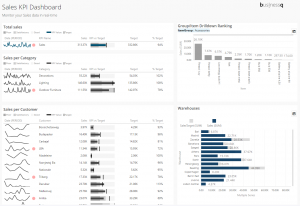
Key Performance Indicators
BusinessQ has special visualization components dedicated to present KPI – Key Performance Indicators. In very simple and intuitive process, with BusinessQ you can visualize you KPIs in minutes. That is possible because we prepared powerful KPI Matrix and KPI Card components; In drag-and-drop interface, from connection to your data to powerful Dashboard in minutes.
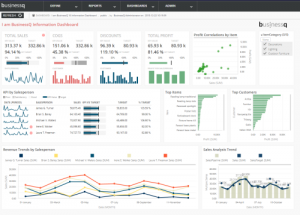
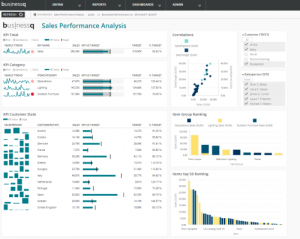
Information Dashboards
Create appropriate BusinessQ Dashboards and take action on what is really important; stay up-to-date with what’s going in your business.
Combine all the data you need from BusinessQ Reports, from multiple data sources and even multiple databases into single Dashboard.