
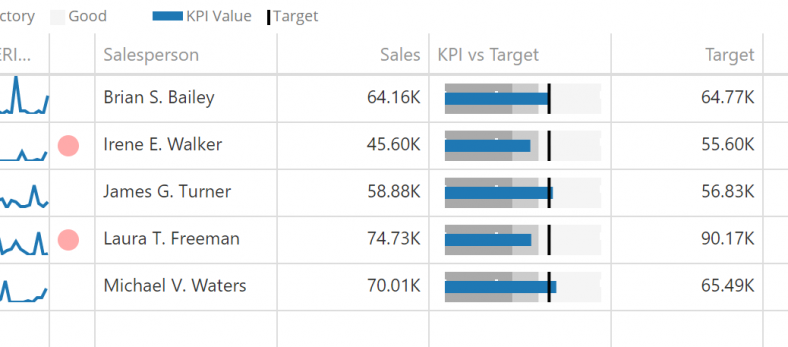
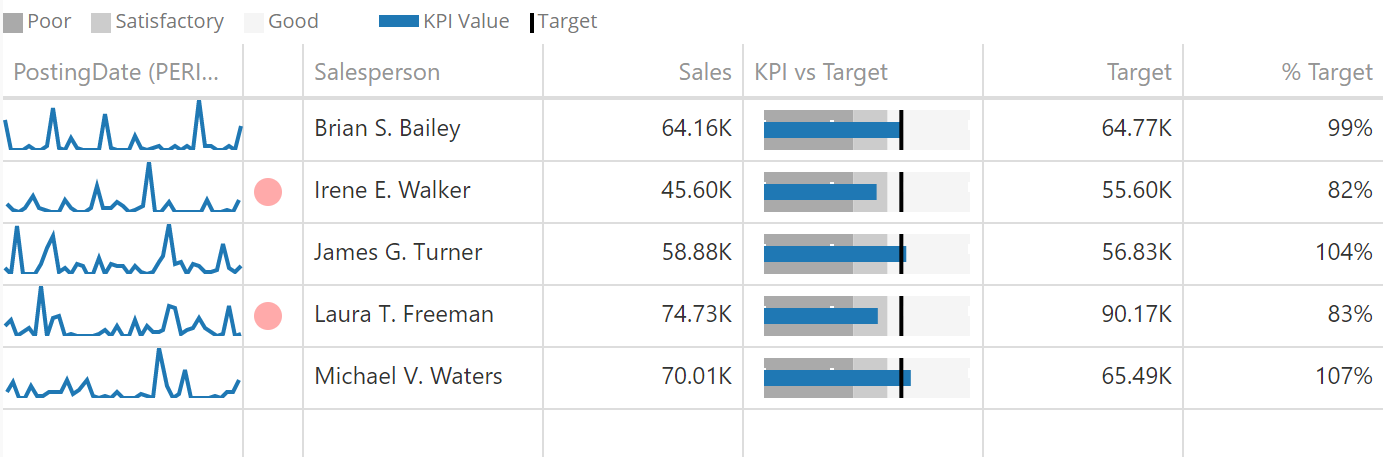
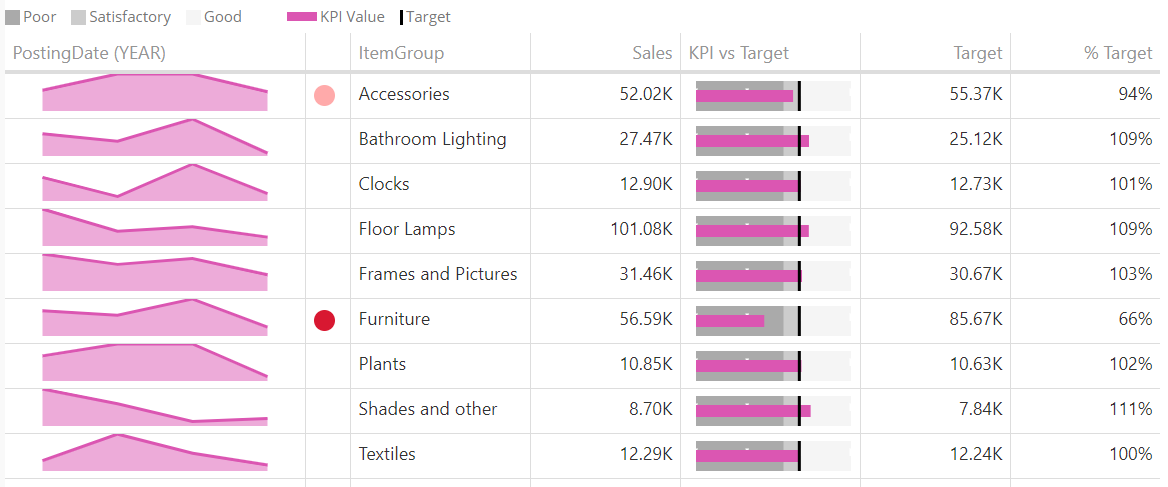
KPI MATRIX
Usage: Key Performance Indicators
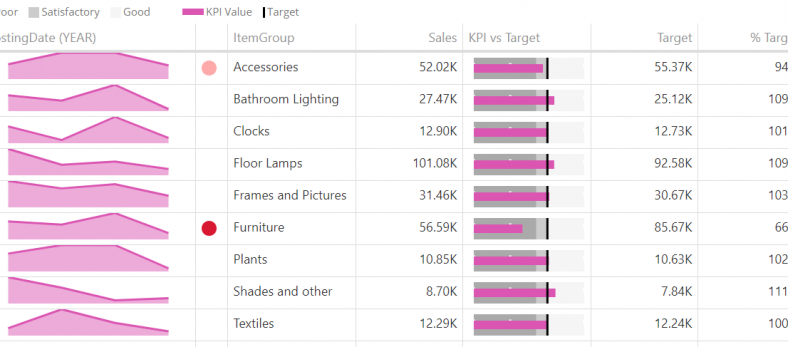
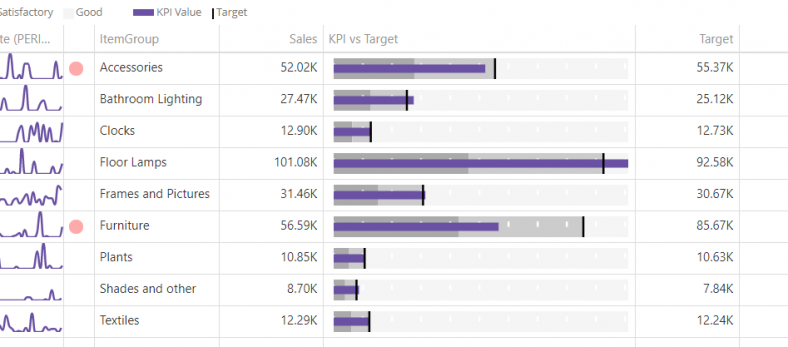
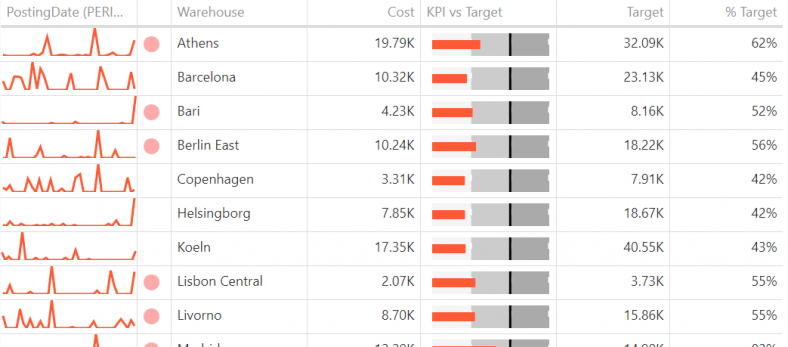
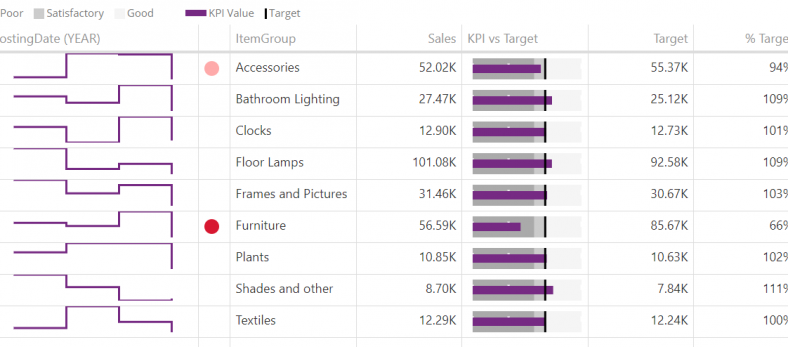
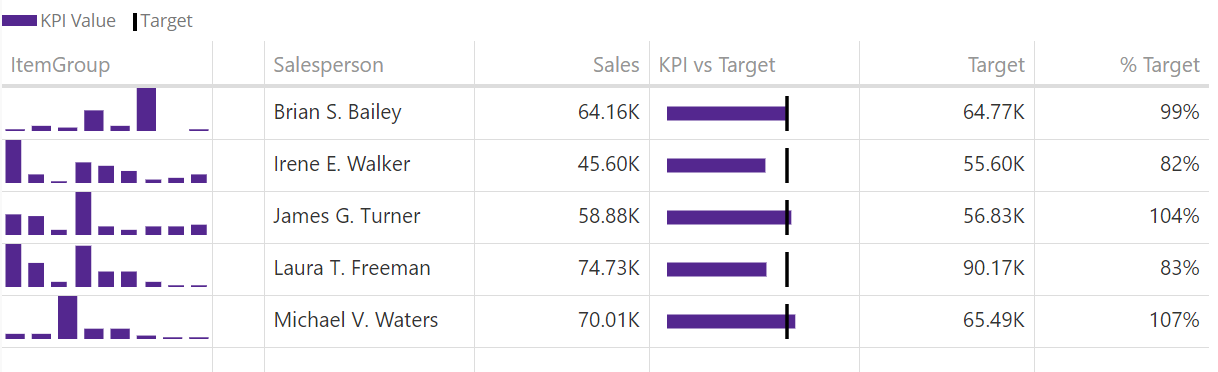
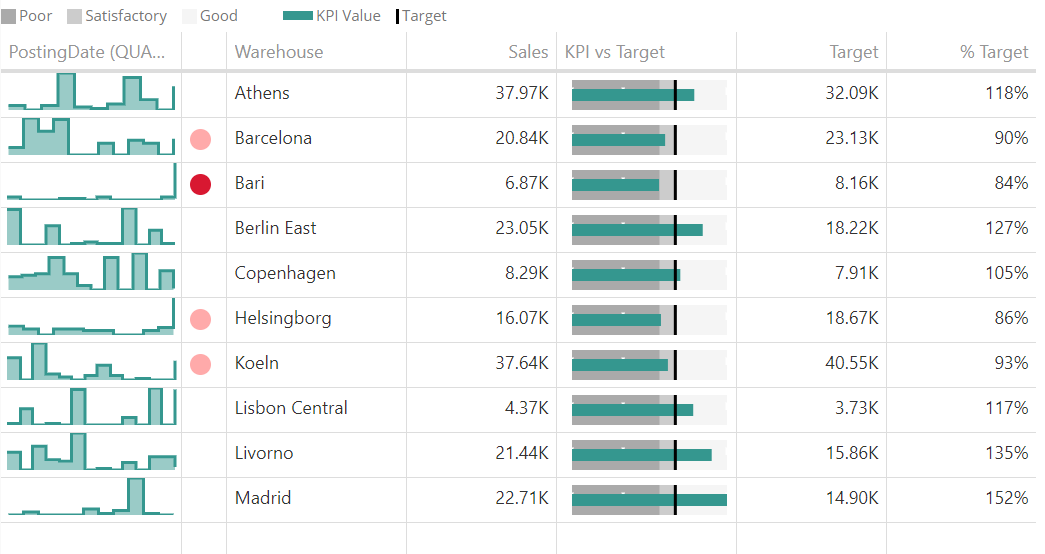
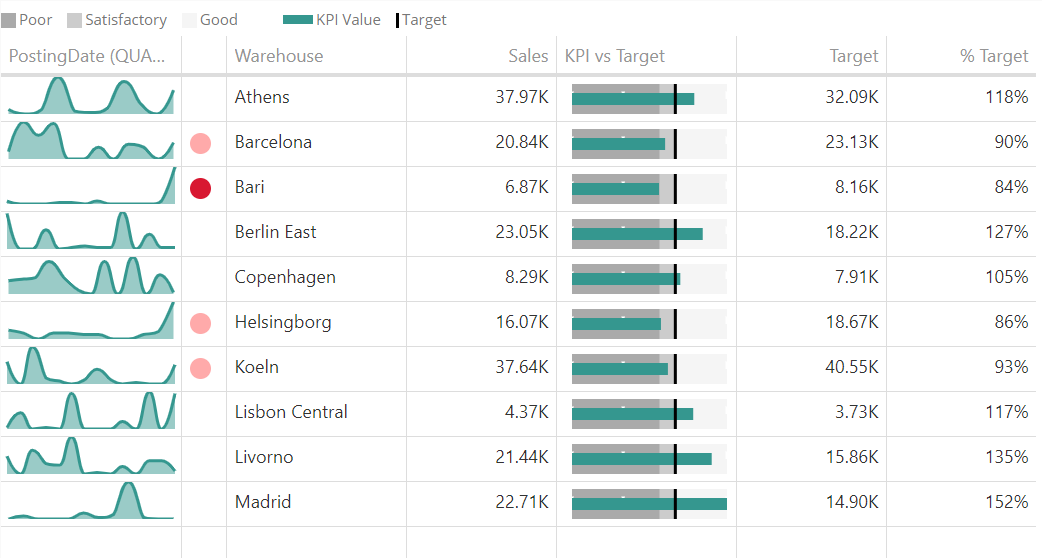
Types of graphs: SparkGraph (Line, curved Line, step Line, Area, curved Area, step Area, Bar), Bullet Chart
Specifics: Trend Field, Target Field, Alerts, Bullet Charts
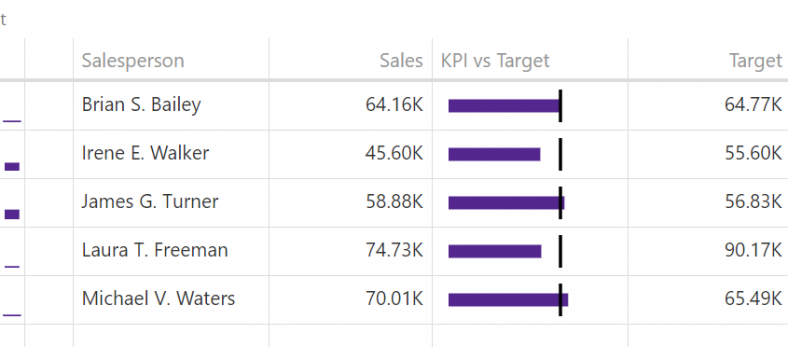
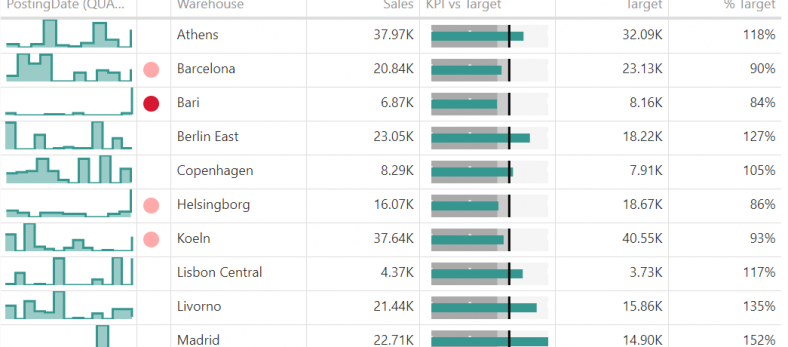
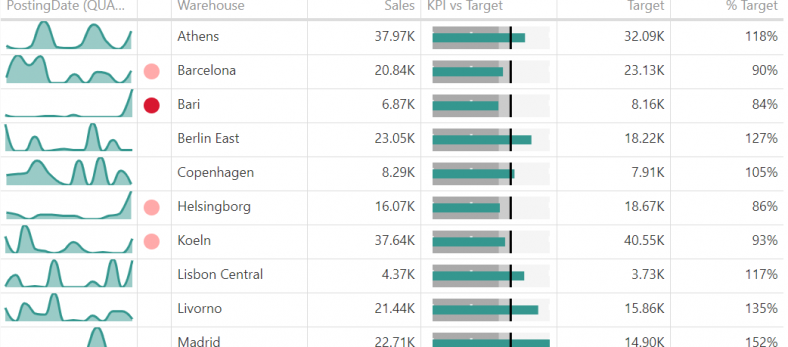
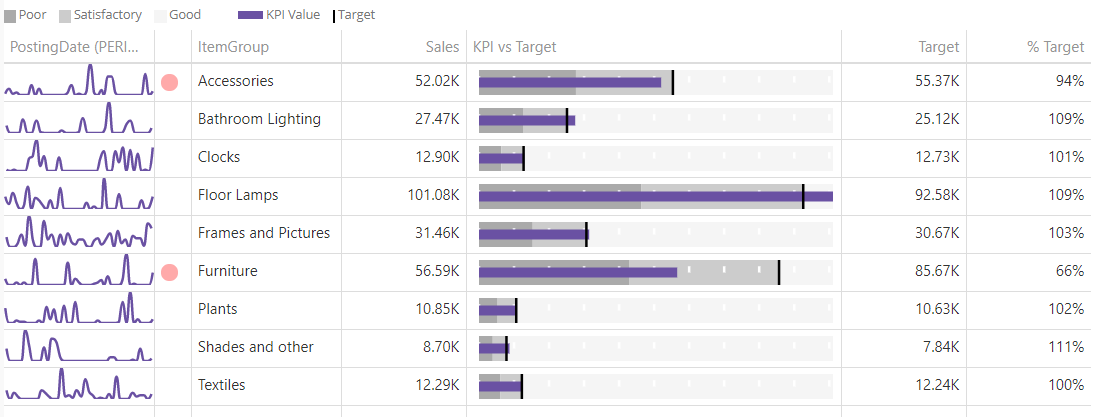
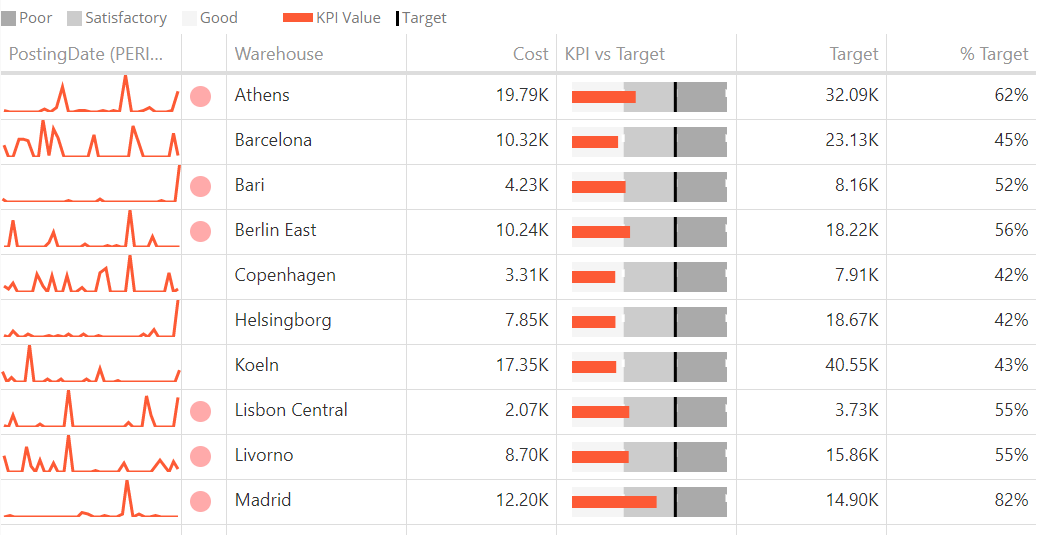
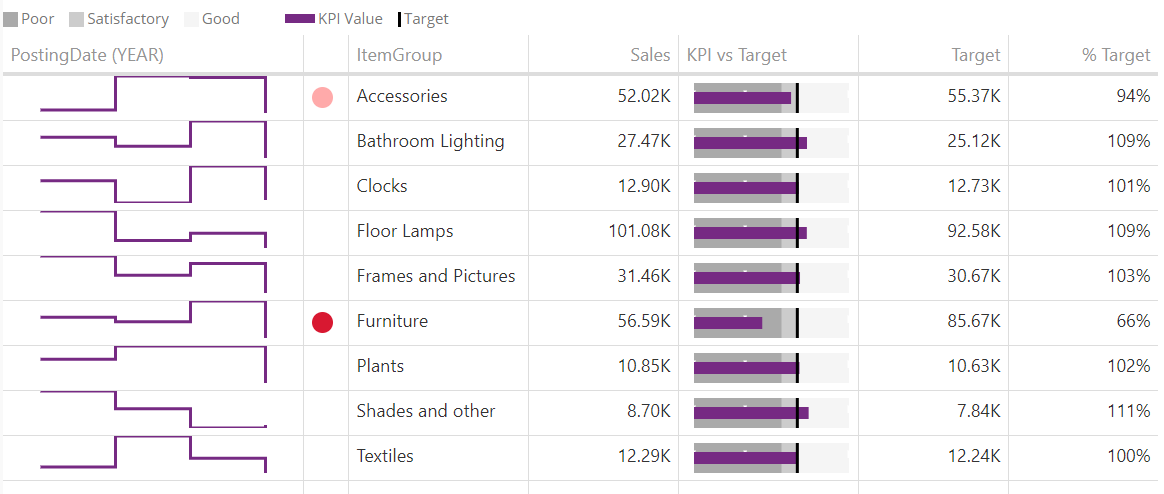

Usage: Key Performance Indicators
Types of graphs: SparkGraph (Line, curved Line, step Line, Area, curved Area, step Area, Bar), Bullet Chart
Specifics: Trend Field, Target Field, Alerts, Bullet Charts