
BUBBLE PLOT
Usage: Correlation
Description: Similar to Scatter Plot, Bubble Plot is defined by 3 value series and the third one controls the size of the data point.
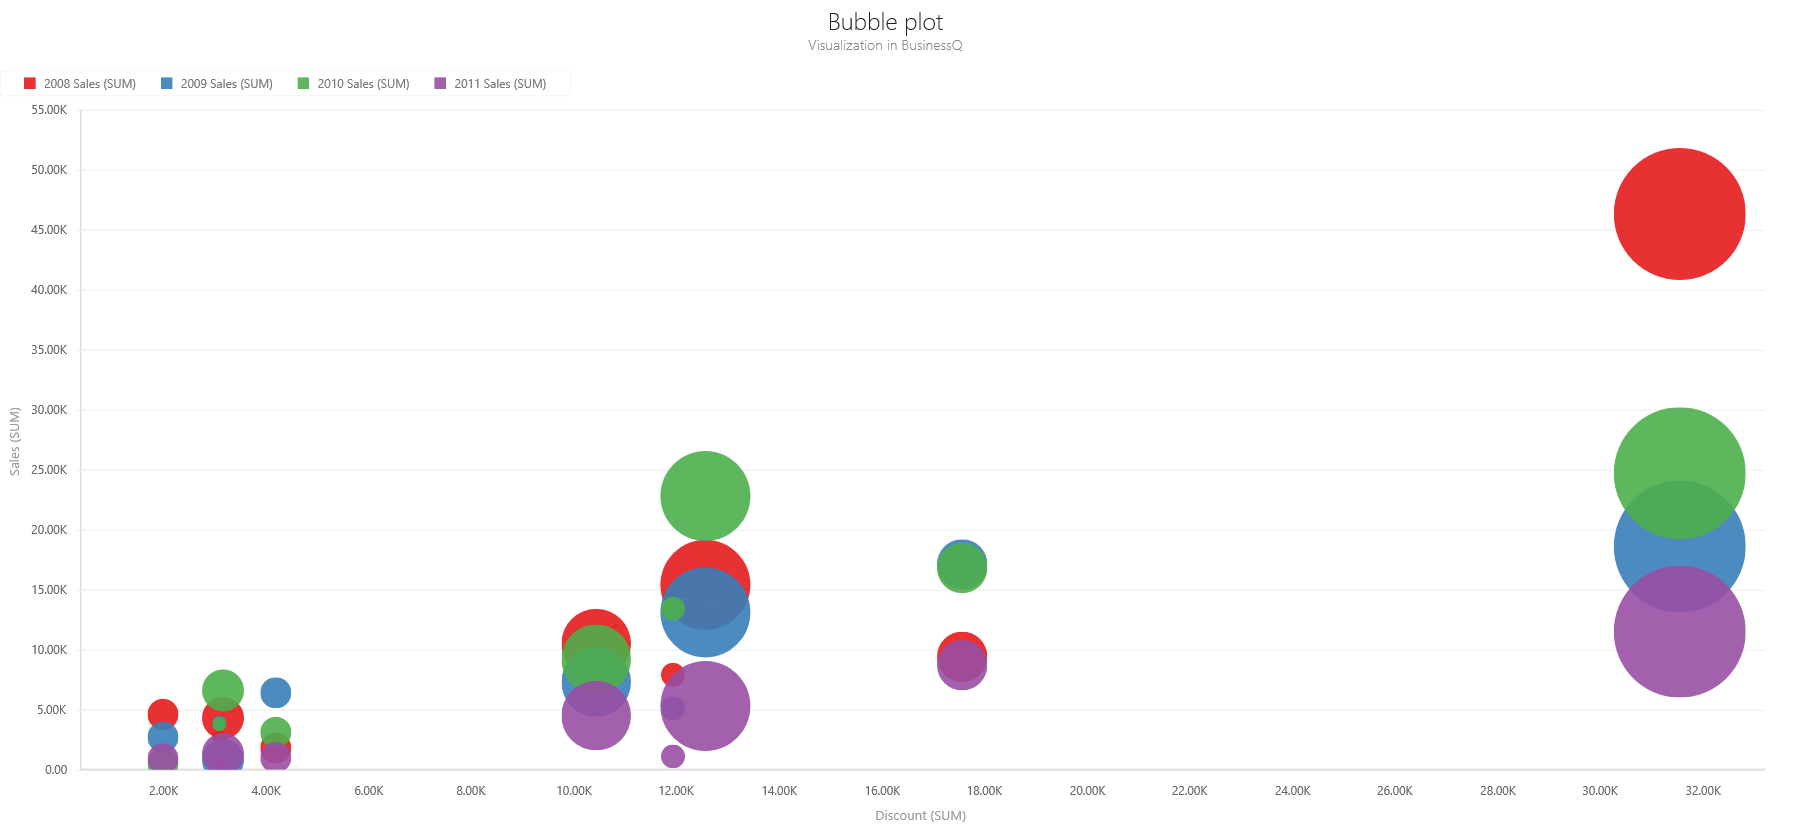


Usage: Correlation
Description: Similar to Scatter Plot, Bubble Plot is defined by 3 value series and the third one controls the size of the data point.